Summary: Excel’s COUNT function efficiently tallies numeric entries, enhancing Data Analysis accuracy. Additionally, counting characters using formulas like LEN aids in text analysis. Mastering these count formulas in Excel is crucial for precise data management and boosting productivity in data-driven tasks.
Introduction
Excel Data Analysis is crucial for making informed decisions based on large datasets. Among Excel’s powerful tools, the COUNT function stands out for its ability to streamline data management. Understanding how to count in Excel allows users to efficiently tally numeric entries, track non-empty cells, and manage data points.
Additionally, mastering the count formula in Excel enhances Data Analysis accuracy. This article aims to provide a comprehensive guide on using the COUNT function, including how to count characters in Excel and apply various count formulas for optimal Data Analysis and management.
Understanding the COUNT Function in Excel
The COUNT function in Excel is a fundamental tool designed to simplify Data Analysis by counting the number of cells that contain numerical values within a given range. It helps users quickly determine the quantity of entries in a dataset, especially when dealing with large amounts of numerical data.
This function is essential for maintaining accuracy and efficiency in data management tasks, making it an indispensable feature for professionals and students.
Purpose of Count in Excel
The primary purpose of the COUNT function is to provide a quick and efficient way to quantify numerical data. It eliminates the need for manual counting, reducing the risk of errors and saving significant time. By automating the counting process, the COUNT function enables users to focus on more complex aspects of Data Analysis, enhancing productivity and accuracy in their work.
Scenarios Where the COUNT Function is Useful
Numerous scenarios prove the COUNT function invaluable. For instance, a sales report often requires counting the number of transactions recorded over a month. Applying the COUNT function to the transaction column lets you instantly determine the total number of sales, providing a clear picture of business performance.
In a classroom setting, teachers can use the COUNT function to tally the number of students who have achieved a passing grade on an exam. By selecting the range of cells containing the students’ grades, the COUNT function will quickly calculate the number of students meeting the passing criteria, aiding in performance evaluation and reporting.
Additionally, the COUNT function is helpful in financial analysis, as it can count the number of financial entries or transactions within specific periods. This capability is crucial for budgeting, forecasting, and auditing purposes. Essentially, anytime you need to quantify the presence of numerical data within a dataset, the COUNT function in Excel is your go-to tool, ensuring accurate and efficient Data Analysis.
Explanation of the Syntax
The syntax of the COUNT function is straightforward, making it accessible even for those new to Excel. The basic structure is `=COUNT(value1, [value2], …)`, where `value1`, `value2`, etc., represent the values or ranges you want to count.
For instance:
`=COUNT(A1:A10)` counts the number of cells with numerical values in the range A1 to A10. This is useful when you have a continuous range of data and want to know how many cells contain numbers.
`=COUNT(A1, A3, A5)` counts the numerical values in cells A1, A3, and A5 individually. This method is handy when you need to count specific, non-contiguous cells.
The function can include multiple ranges and individual cells, making it flexible for various counting needs. For example, `=COUNT(A1:A10, B1:B10)` will count all numerical values in both ranges A1:A10 and B1:B10. This flexibility allows users to customise their counting parameters based on the specific requirements of their Data Analysis tasks.
By mastering the syntax of the COUNT function, users can leverage its full potential, ensuring accurate and efficient Data Analysis in a wide range of scenarios. Whether dealing with sales data, academic records, or financial transactions, the COUNT function in Excel simplifies the counting process, enhancing overall productivity and accuracy.
Also Read: Creating Waterfall Chart in Excel: Step-by-Step Tutorial.
Stacked waterfall chart in Excel – Step by Step Tutorial.
How to Use the COUNT Function

The COUNT function in Excel is a powerful tool for Data Analysis, enabling you to determine the number of numerical entries in a range quickly. By mastering this function, you can efficiently manage large data sets and enhance your analytical capabilities.
Step-by-Step Instructions on Using the COUNT Function
Understanding step-by-step instructions for using the COUNT function is crucial for efficient Data Analysis. Using the COUNT function is straightforward, making it accessible even for beginners. Here’s a step-by-step guide to help you get started.
Step 1: Open Your Excel Worksheet: Open the Excel file where you want to apply the COUNT function.
Step 2: Select the Cell for the Result: Click on the cell where you want the count result to appear.
Step 3: Enter the COUNT Formula: Type `=COUNT(` in the selected cell.
Step 4: Select the Range of Cells: Highlight the cells you want to count. You can do this by manually clicking and dragging your mouse over the cells or by typing the cell range (e.g., `A1:A10`).
Step 5: Complete the Formula: Close the parenthesis by typing `)`, then press Enter. The cell will now display the count of numerical values within the specified range.
Selecting the Range of Cells
Selecting the appropriate range of cells is pivotal to ensure precise outcomes when using the COUNT function in Excel. It’s essential to meticulously choose cells that exclusively contain numerical data for accurate counting. Excel strictly counts numerical values within the designated range, disregarding any text entries or blank cells.
Verifying and adjusting the selected range guarantees that your COUNT function operates effectively, providing reliable numerical analysis and insights from your data sets. This attention to detail not only enhances accuracy but also streamlines your data management processes within Excel.
Applying the COUNT Function
Once you’ve selected the range of cells containing numerical data, applying the COUNT function is seamless. Excel swiftly calculates the total count of these numeric entries within the specified range and immediately presents the result in the designated cell.
This efficiency makes the COUNT function invaluable for swiftly assessing extensive datasets. It provides instant insights into the number of numeric values present without manual counting, thus streamlining Data Analysis and enhancing productivity in Excel tasks.
Examples with Different Data Sets
Understanding examples with various data sets enhances learning by illustrating diverse applications and scenarios. Exploring varied data sets cultivates a deeper grasp of concepts, preparing one to tackle real-world challenges with creativity and precision.
To illustrate, consider a data set in cells A1 to A10 containing numbers and text:
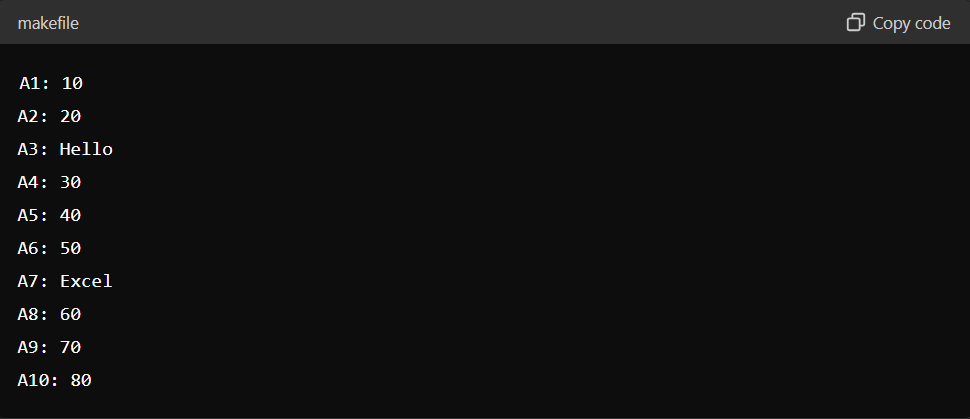
By applying `=COUNT(A1:A10)`, Excel will return 7, as seven numerical values are in the range.
Common Mistakes and How to Avoid Them
Knowing common mistakes in Excel’s COUNT function prevents errors in Data Analysis. Understanding issues ensures accurate results. Here are the list of common mistakes that usually occur when using COUNT in Excel:
Incorrect Range Selection: Verify the selected range before applying the COUNT function to ensure it includes only the cells with numerical values. Incorrect ranges lead to inaccurate counts.
Counting Text Entries: The COUNT function ignores text entries and counts only numerical values. Use the COUNTA function if you need to include text entries or want to count non-blank cells regardless of content.
Not Updating Ranges: As your data set evolves, update the range referenced in the COUNT function to reflect the current data. Failure to update ranges can lead to outdated or incorrect counts.
Ignoring Error Values: The COUNT function does not count error values such as #VALUE! or #DIV/0! Be aware of error values in your data set and handle them appropriately before applying the COUNT function.
Overlooking Filtered Data: If your data is filtered, the COUNT function counts all visible cells by default. Ensure your data filters are applied correctly to get accurate count results based on filtered criteria.
Tips for Efficient Use of the COUNT Function
Understanding tips for efficiently using the COUNT function enhances spreadsheet proficiency. Mastery ensures streamlined data management and error reduction and boosts productivity in both personal and professional contexts. To improve your use of the COUNT function in Excel, consider these advanced tips:
Use Named Ranges: Define and use named ranges for easier reference and reduced errors.
Combine with Other Functions: Enhance functionality by combining COUNT with functions like IF for conditional counting.
Utilise Data Validation: Ensure your data is clean and well-organised for more accurate counting.
Regularly Update Ranges: Adjust your cell ranges as your data set grows to maintain accuracy.
By following these steps and tips, you can effectively use the COUNT function in Excel, improving your Data Analysis and management efficiency.
More For You To See:
MIS Report in Excel? Definition, Types & How to Create.
Basic Keyboard Shortcuts in MS Excel.
Counting Characters in Excel

Counting characters within cells is crucial in Excel, especially when dealing with text data. Excel provides powerful functions like LEN to accurately count characters, offering insights into data length and facilitating various data management tasks.
Introduction to Counting Characters within Cells
In Excel, counting characters involves determining the number of characters in a cell or a range of cells. This is particularly useful for verifying data entry limits, analysing text lengths for consistency, or preparing data for further processing.
Explanation of the LEN Function: =LEN(text)
The LEN function in Excel is straightforward yet powerful. It returns the number of characters in a given text string, including spaces and punctuation. Its syntax is simple: `=LEN(text)`, where ‘text’ is the cell reference or the actual text string enclosed in quotation marks. For example, `=LEN(A1)` will count the characters in cell A1.
Combining LEN with Other Functions for Counting Characters Across Multiple Cells
To extend the usefulness of the LEN function, it can be combined with other Excel functions, such as SUM. This combination allows for efficiently counting characters across multiple cells or ranges. For instance, if you have text data spread across several cells (A1 to A10), you can use `=SUM(LEN(A1:A10))` to get the total number of characters in those cells.
This technique is convenient when dealing with datasets that involve lengthy text entries or when you need to aggregate character counts from various sources into a single metric.
Practical Examples and Use Cases
To illustrate the practical application of counting characters in Excel, consider a scenario where you manage a database of product descriptions. Each description is stored in a separate cell. Using the LEN function, you can quickly determine the length of each description and ensure consistency across all entries.
This ensures that all descriptions meet a predefined length requirement, improving data quality control and readability.
Another example is analysing customer feedback comments. By counting characters, you can categorise feedback based on comment length, identify trends in sentiment based on comment length, or prepare reports summarising customer opinions concisely.
More In Your Interest: How do you become a Certified Microsoft Excel Expert?
Other COUNT Formulas in Excel

Excel offers a variety of COUNT formulas to suit different Data Analysis needs. Understanding each formula’s nuances can significantly enhance your ability to manipulate and analyse data effectively. You will find different COUNT formulas in Excel, as well as their differences and similarities mentioned below:
COUNTA
The COUNTA function counts all non-empty cells within a range, including those containing text, numbers, dates, errors, or logical values. Use COUNTA to count all entries (text, numbers, errors) except blanks in a range. For instance, to count the total number of entries in a list.
Example: In a range containing values like “Apple”, “Orange”, 10, and blank cells, `=COUNTA(A1:A10)` would return 3 (counting “Apple”, “Orange”, and 10).
COUNTBLANK
The COUNTBLANK function counts the number of blank cells within a specified range. Use COUNTBLANK to quickly determine how many cells are empty in a given range. For example, it can be used to determine how many orders still need to be filled in a sales spreadsheet.
Example: In a range where cells A1 to A10 contain data and some cells are blank, `=COUNTBLANK(A1:A10)` would return the number of blank cells.
COUNTIF
COUNTIF and COUNTIFS are used to count cells that meet specific criteria. It counts the number of cells within a range that meet a single condition. Use COUNTIF to count cells based on a single criterion, such as counting all sales above a certain threshold.
Example: In a range of sales figures (A1 to A10), `=COUNTIF(A1:A10, “>1000”)` would count how many sales figures exceed 1000.
COUNTIFS
COUNTIFS counts the number of cells within a range that meet multiple criteria. Use COUNTIFS when applying various criteria to count cells, such as products sold by a specific salesperson that exceed a particular quantity.
Example: In a range where column A contains product names and column B contains salesperson names, `=COUNTIFS(A1:A10, “ProductA”, B1:B10, “John”)` would count how many times “ProductA” was sold by “John”.
Differences and Similarities
While COUNT and COUNTA count all and non-empty cells, respectively, COUNTBLANK focuses solely on blank cells. COUNTIF and COUNTIFS, on the other hand, allow you to specify criteria for counting, making them versatile tools for Data Analysis.
When to Use Each COUNT Formula:
COUNT: Use when counting numeric data.
COUNTA: Use when counting all types of non-empty cells.
COUNTBLANK: Use when counting blank cells.
COUNTIF: Use when counting cells based on a single criterion.
COUNTIFS: Use when counting cells based on multiple criteria.
Mastering these COUNT formulas equips you with essential skills for efficiently analysing data in Excel, ensuring you can easily extract meaningful insights.
Advanced Techniques

Understanding advanced techniques of the COUNT function in Excel enhances efficiency in Data Analysis. It enables precise counting based on multiple criteria, including logical conditions, text, and numeric ranges. Here’s what advanced techniques are:
Combining COUNT Functions with Other Excel Functions
Combining the COUNT function with other functions can significantly enhance your Data Analysis capabilities in Excel. By integrating COUNT with IF, AND, and OR functions, you can create more sophisticated criteria for counting specific data points.
When you combine COUNT with IF, you can count cells that meet certain conditions. For instance, `=COUNTIF(range, criteria)` counts the number of cells within a specified range that meet the given criteria. This is useful for conditional counting based on values, dates, or text.
Example: Imagine you have a dataset where you want to count how many sales transactions exceed a certain amount. Using `=COUNTIF(A2:A100, “>1000”)`, Excel will count all cells in the range A2 to A100 that contain values greater than 1000.
When to Use: This technique is beneficial when you need to segment your data and count specific occurrences that meet certain conditions, providing more nuanced insights into your dataset.
Using COUNT Functions with Conditional Formatting
Conditional formatting in Excel allows you to highlight cells based on their values visually. You can dynamically highlight cells that meet specific counting criteria by integrating COUNT functions with conditional formatting rules.
Using COUNT functions within conditional formatting rules lets you visually identify patterns or outliers in your data based on counts. For example, you can highlight all cells with a count more remarkable than a certain threshold to draw attention to important data points.
Example: Suppose you have a range of cells containing sales figures and want to highlight all cells where sales exceed 100 units. You can set a conditional formatting rule using a formula like `=COUNT(A2:A100) > 100` to highlight cells automatically.
Benefits: This approach simplifies data interpretation and enhances data visualisation, making spotting trends or anomalies within large datasets easier.
Leveraging COUNT Functions in Data Validation
Data validation ensures that data entered into cells meets specific criteria. Using COUNT functions within data validation rules, you can control input based on counting conditions, ensuring data integrity and accuracy.
Integrating COUNT functions in data validation allows you to restrict or validate user input based on the count of existing data. For example, you can limit the number of entries or enforce unique values within a range.
Example: Suppose you’re managing a project where each team member can only work on up to 5 tasks. Using data validation with a custom formula like `=COUNTIF(B2:B100, “<=5”)`, you can prevent users from assigning more than 5 tasks to any team member.
Advantages: This technique enhances data consistency and reduces errors by enforcing predefined rules based on counted criteria, ensuring data accuracy across Excel workbooks.
Real-Life Examples and Complex Scenarios
Real-life applications of COUNT functions extend beyond basic counting tasks. Complex scenarios may involve combining multiple COUNT functions nested within other Excel functions to address specific analytical challenges.
Real-life examples illustrate the versatility of COUNT functions in solving complex analytical problems. These scenarios often require combining COUNT with other functions or using COUNT in unconventional ways to derive meaningful insights.
Example: Consider a customer database in which you must segment customers based on purchase frequency and total purchases. You can create detailed customer segmentation reports by using nested COUNTIFS formulas combined with SUM and IF functions.
Implications: Such advanced applications demonstrate Excel’s capability to handle intricate Data Analysis tasks effectively, empowering users to extract actionable insights from diverse datasets.
Incorporating these advanced techniques into your Excel toolkit not only expands your analytical capabilities but also enhances your ability to manipulate and interpret data with precision. Mastering these methods will enable you to leverage Excel’s full potential for sophisticated Data Analysis and reporting.
Frequently Asked Questions
How do I use the COUNT function in Excel?
The COUNT function in Excel tallies numeric entries within a specified range, aiding in Data Analysis. Use “=COUNT(range)” to count numeric cells efficiently.
Why is counting characters important in Excel?
Counting characters in Excel, using functions like LEN, ensures data accuracy and aids in text analysis for fields like product descriptions and customer feedback.
What are the different COUNT formulas in Excel?
Excel offers COUNT, COUNTA, COUNTBLANK, COUNTIF, and COUNTIFS for various data counting needs—from numeric data to specific criteria like sales figures.
Conclusion
Mastering the COUNT function in Excel is crucial for efficient data management and analysis. By learning to count in Excel, users can streamline tasks such as sales tracking, academic grading, and financial analysis, including characters with formulas like LEN. These capabilities enhance productivity and accuracy in professional settings.
Excel’s COUNT, COUNTA, COUNTBLANK, COUNTIF, and COUNTIFS formulas cater to diverse counting needs, from numeric data to specific criteria. Whether for business reports or academic evaluations, understanding these functions ensures precise Data Analysis and empowers users to derive meaningful insights from their datasets, solidifying Excel’s role as an indispensable tool in modern data-driven environments.
Authors
-

Written by:
Sam WaterstonReviewed by: