
Summary: The ROC Curve and AUC are essential for evaluating binary classifiers in Machine Learning. The ROC Curve plots True Positive vs. False Positive rates, while AUC quantifies overall performance. Both metrics help assess model effectiveness, especially in imbalanced datasets.
Introduction
Evaluating Machine Learning models is crucial to ensure their effectiveness and reliability. Among various evaluation metrics, the ROC Curve and AUC in Machine Learning stand out for their ability to illustrate model performance comprehensively.
The ROC Curve helps visualise the trade-off between true positive and false positive rates, while AUC quantifies this performance into a single value.
This article aims to demystify the ROC Curve and AUC, explain their importance, and guide you on how to plot and interpret them using practical examples. By the end, you’ll understand their significance and be equipped to apply these concepts in your projects.
Read: Stable Diffusion in Machine Learning: An In-depth Analysis.
Understanding ROC Curve
The ROC (Receiver Operating Characteristic) Curve is a graphical representation used to evaluate the performance of a binary classification model. It illustrates the trade-off between the True Positive Rate (TPR) and the False Positive Rate (FPR) across various threshold settings.
Originating from signal detection theory, the ROC Curve helps distinguish between the signal (true positives) and the noise (false positives).
Two main components define the ROC Curve:
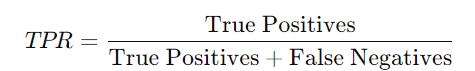
- True Positive Rate (TPR): Also known as sensitivity or recall, TPR measures the proportion of actual positives correctly identified by the model. It is calculated as:
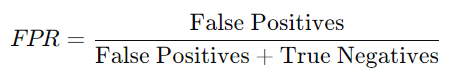
- False Positive Rate (FPR): FPR measures the proportion of actual negatives incorrectly identified as positives. It is calculated as:
Explanation of the ROC Curve Graph
The ROC Curve graph plots TPR on the y-axis and FPR on the x-axis. Each point on the graph represents a different threshold for classifying a positive result.
A model with perfect discrimination will have a point in the upper left corner of the graph, indicating 100% sensitivity and 0% false positive rate. The diagonal line from the bottom left to the top right represents a random classifier with no discriminative power between positive and negative classes.
How to Interpret the ROC Curve
To interpret the ROC Curve, you look at the area under the curve (AUC). A higher AUC value indicates better model performance. If the curve hugs the top-left corner, the model has high TPR and low FPR, signifying good performance.
Conversely, a curve close to the diagonal line indicates poor performance, as the model does not effectively distinguish between positive and negative cases.
Explore More:
Understanding Radial Basis Function In Machine Learning.
Anomaly detection Machine Learning algorithms.
Understanding AUC in Machine Learning
AUC, or Area Under the Curve, quantifies a classification model’s overall performance. It measures the entire two-dimensional area under the entire ROC (Receiver Operating Characteristic) curve, which plots the True Positive Rate (TPR) against the False Positive Rate (FPR) at various threshold settings.
The value of AUC ranges from 0 to 1, with higher values indicating better model performance.
The Relationship Between ROC Curve and AUC
The ROC curve visualizes the trade-off between sensitivity (TPR) and specificity (1 – FPR) for different decision thresholds. AUC provides a single metric to summarize this trade-off.
Essentially, AUC represents the probability that a randomly chosen positive instance is ranked higher than a randomly chosen negative instance. The ROC curve offers a graphical representation, while AUC condenses this information into a scalar value.
Significance of AUC in Model Evaluation
AUC is a crucial metric for evaluating the performance of classification models, especially when dealing with imbalanced datasets. Unlike accuracy, AUC is not biased towards the majority class, making it a more reliable indicator of model performance.
It provides a clear insight into how well the model distinguishes between classes. Higher AUC values indicate a better balance between sensitivity and specificity, reflecting the model’s robustness in identifying true positives while minimising false positives.
Let’s look at the Interpretation of Different AUC Values:
- AUC = 0.5: The model performs no better than random chance, indicating a poor classification model.
- 0.5 < AUC < 0.7: The model performs better than random guessing but is still relatively weak. There is room for improvement.
- 0.7 ≤ AUC < 0.9: The model performs well, effectively distinguishing between positive and negative classes.
- AUC ≥ 0.9: The model exhibits excellent performance, with a high capability to differentiate between the classes.
Check: Learn Top 10 Deep Learning Algorithms in Machine Learning.
Importance of ROC Curve and AUC in Machine Learning
Evaluating the performance of Machine Learning models is crucial to ensure their effectiveness and reliability. The ROC Curve (Receiver Operating Characteristic Curve) and AUC (Area Under the Curve) are powerful tools in this evaluation process. They provide insights beyond traditional metrics, making them essential for a comprehensive understanding of model performance.
Why ROC Curve and AUC are Preferred for Model Evaluation
ROC Curve and AUC are preferred for model evaluation because they offer a more nuanced view of a model’s performance. The ROC Curve plots the true positive rate (sensitivity) against the false positive rate (1-specificity) at various threshold settings. This visualization helps identify how well the model distinguishes between classes.
AUC quantifies this performance by measuring the entire two-dimensional area underneath the ROC Curve. An AUC of 0.5 suggests no discriminative power, akin to random guessing, while an AUC of 1.0 indicates perfect classification. This single metric provides a holistic measure of the model’s ability to differentiate between positive and negative classes, regardless of the chosen threshold.
Comparison with Other Evaluation Metrics
While accuracy, precision, and recall are important metrics, they have limitations that ROC Curves and AUC effectively address.
- Accuracy: It measures the proportion of correctly classified instances among the total cases. However, it can be misleading, especially in imbalanced datasets where one class predominates. High accuracy in such cases reflects the model’s bias towards the majority class.
- Precision (positive predictive value): It is the ratio of true positives to the sum of true positives and false positives. It focuses on the relevance of the positive predictions but ignores the negatives.
- Recall (sensitivity): This is the ratio of true positives to the sum of true positives and false negatives. It emphasises capturing all positive instances but doesn’t account for false positives.
ROC Curve and AUC provide a more comprehensive evaluation by considering both the true positive and false positive rates across all threshold levels. This makes them more robust in evaluating models, especially in scenarios with class imbalance or varying costs of false positives and false negatives.
Use Cases and Examples
The ROC Curve and AUC are invaluable in numerous real-world scenarios where accurate model evaluation is crucial. These tools provide deep insights into model performance, making them essential across diverse fields such as healthcare, finance, fraud detection, marketing, and more. Here’s a closer look at their practical applications:
Healthcare
Accurately distinguishing between diseased and healthy individuals is crucial in medical diagnostics. ROC Curves and AUC help evaluate the diagnostic tests’ effectiveness by balancing sensitivity and specificity. For instance, in cancer detection, a high AUC indicates that the test reliably identifies patients with cancer while minimizing false alarms.
Finance
Credit scoring models must differentiate between good and bad credit risks. ROC Curves and AUC enable the evaluation of these models by showing their ability to identify risky applicants accurately without rejecting too many good ones. A robust AUC helps set optimal credit approval thresholds.
Fraud Detection
In fraud detection systems, detecting fraudulent activities while minimizing false positives is essential. ROC Curve and AUC assist in fine-tuning these models to achieve the best trade-off. For example, in transaction fraud detection, a high AUC means the system effectively flags fraudulent transactions with minimal impact on legitimate transactions.
Marketing
Targeting the right customers for a campaign can significantly impact its success. ROC Curve and AUC help evaluate models that predict customer response, ensuring that the marketing efforts are focused on the most likely respondents while reducing the cost of reaching uninterested customers.
Discover: A Guide to Principal Component Analysis in Machine Learning.
How to Plot ROC Curve and Calculate AUC
To effectively evaluate the performance of your Machine Learning models, understanding how to plot the ROC Curve and calculate the AUC is essential. This section will guide you through the process using Python libraries like Scikit-learn and Matplotlib. We’ll explain each step and provide code examples to help you implement these techniques in your projects.
Must See: Matplotlib Cheat Sheet: Visualize Data Like a Pro.
Step-by-Step Guide on Plotting ROC Curve
The ROC Curve is a graphical representation of the performance of a binary classifier. It plots the True Positive Rate (TPR) against the False Positive Rate (FPR) at various threshold settings.
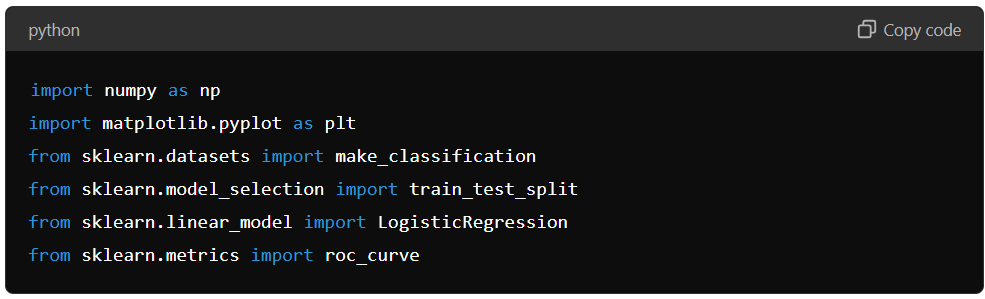
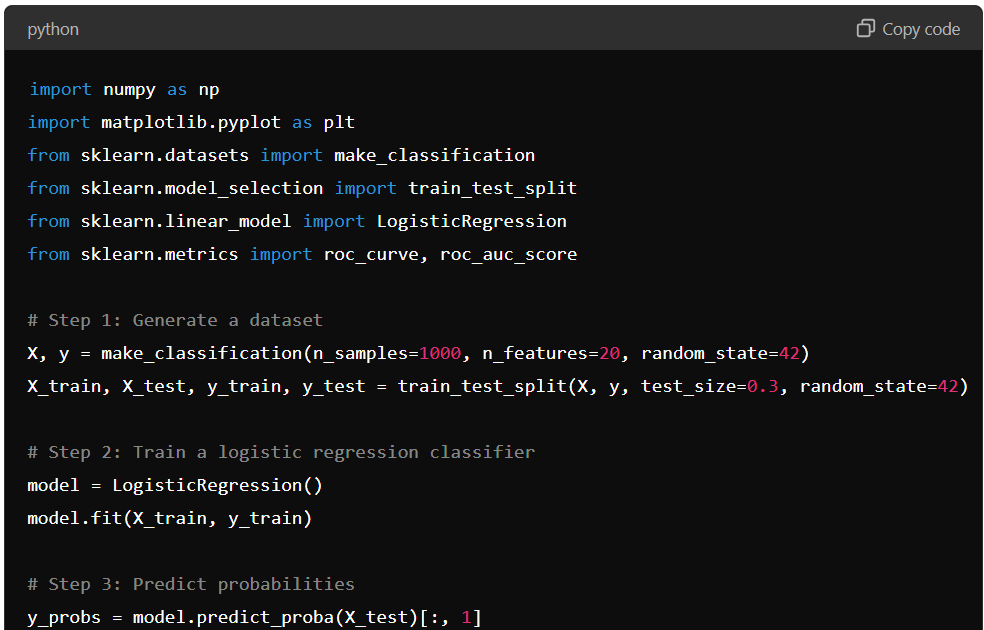
1. Import Necessary Libraries
To get started, you need to import the required libraries. Scikit-learn provides functions to compute ROC curves, and matplotlib is used for plotting.
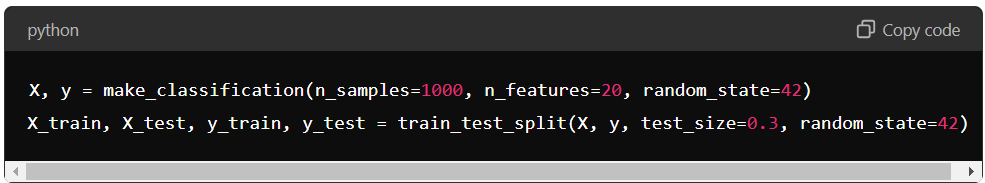
2. Generate a Dataset
We’ll create a synthetic binary classification dataset for demonstration purposes using scikit-learn’s make_classification function.
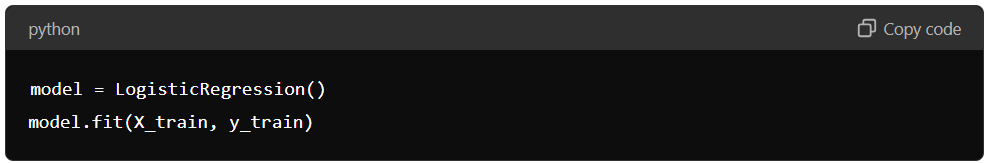
3. Train a Classifier
Next, we’ll train a logistic regression model on the training data.
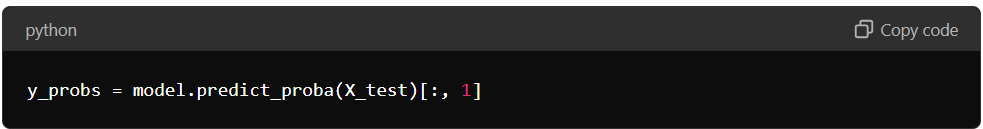
4. Predict Probabilities
We need the predicted probabilities for the positive class to plot the ROC Curve.
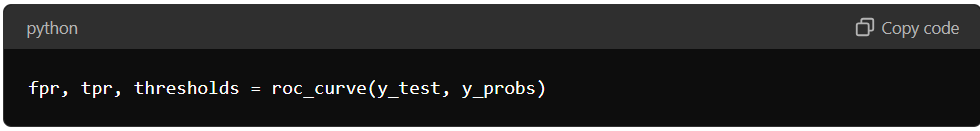
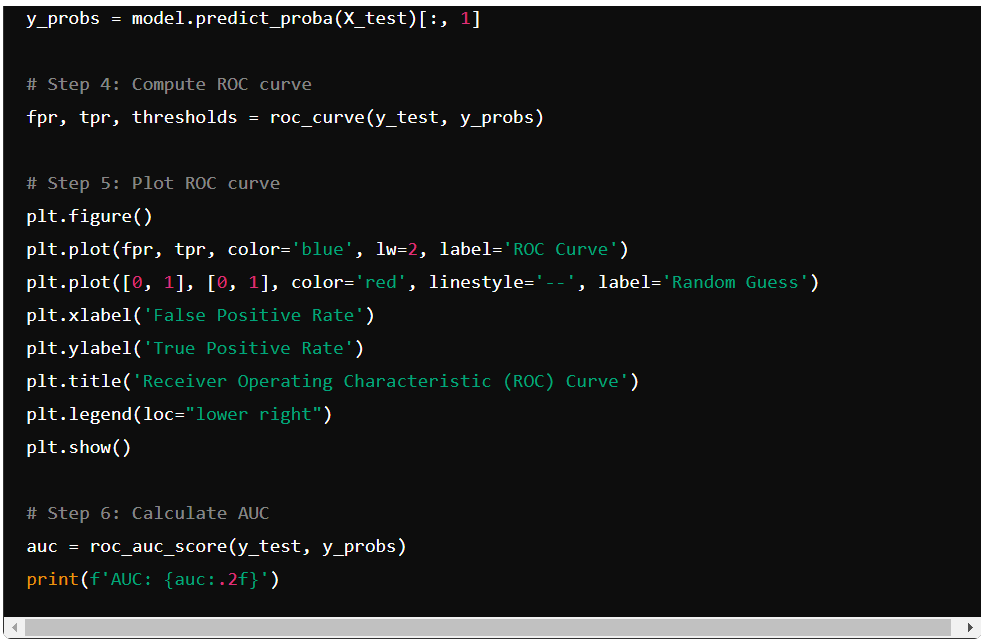
5. Compute ROC Curve
Use roc_curve to compute the False Positive Rate (FPR) and True Positive Rate (TPR) at different threshold values.
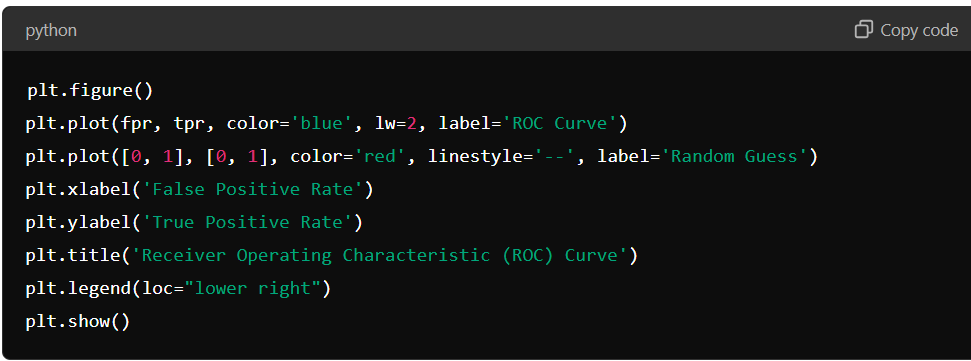
6. Plot ROC Curve
Now, plot the ROC Curve using matplotlib.
Step-by-Step Guide on Calculating AUC
The Area Under the Curve (AUC) quantifies the model’s overall ability to discriminate between positive and negative classes. A higher AUC value indicates a better-performing model.
1. Import Necessary Libraries
If not already imported, ensure you have the necessary libraries.

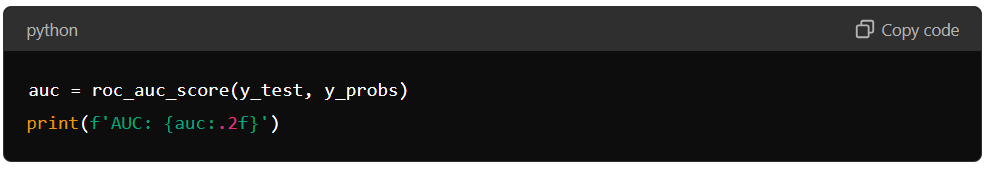
2. Compute AUC
Using the true labels and the predicted probabilities, compute the AUC.
Code Examples and Explanations
Combining all the steps, here is the complete code to plot the ROC Curve and calculate the AUC for a logistic regression model.
This script walks you through generating data, training a model, predicting probabilities, computing the ROC curve, plotting the ROC curve, and calculating the AUC.
By following these steps, you can evaluate the performance of your binary classifiers and make informed decisions about their effectiveness. The visual representation of the ROC Curve, along with the AUC value, provides valuable insights into the model’s ability to distinguish between classes.
Read Blog: Scikit-Learn Cheat Sheet: A Comprehensive Guide.
Limitations and Considerations
While the ROC Curve and AUC are powerful tools for evaluating Machine Learning models, they have certain limitations and considerations that users must be aware of to make informed decisions. Understanding these constraints helps in effectively applying these metrics and avoiding common pitfalls.
Potential Limitations of ROC Curve and AUC
The Receiver Operating Characteristic (ROC) curve and the Area Under the Curve (AUC) are widely used metrics for evaluating the performance of binary classifiers. However, they come with several limitations that can affect their effectiveness in certain contexts. Here are some potential limitations of ROC curves and AUC:
Lack of Contextual Relevance
ROC curves do not provide information on the clinical relevance of different thresholds. While they illustrate the trade-off between sensitivity and specificity, they do not indicate which cut-off point is most appropriate for a specific application, particularly in clinical settings where the costs of false positives and false negatives can vary significantly.
Sensitivity to Class Imbalance
ROC curves can portray an overly optimistic performance of a classifier when applied to imbalanced datasets. In scenarios where one class is significantly underrepresented, the AUC may not accurately reflect the model’s ability to discriminate between classes, leading to misleading conclusions about its performance.
Incorporation of Low Sensitivity and Specificity Areas
The AUC calculation includes areas of low sensitivity and specificity, which may not be of practical interest. This can dilute the overall assessment of a model’s performance, as it incorporates regions where the classifier performs poorly.
Misleading Comparisons
When comparing multiple classifiers, ROC curves can cross each other. Relying solely on the AUC for comparison can be misleading, as a higher AUC does not always indicate better performance across all thresholds. This necessitates a more nuanced evaluation of classifiers beyond just their AUC values.
Ignoring Cost of Errors
ROC analysis does not take into account the costs associated with different types of errors (false positives vs. false negatives). In many applications, particularly in healthcare, the consequences of these errors can vary greatly, making it essential to consider the economic and clinical implications when evaluating model performance.
Considerations When Using ROC Curve and AUC in Model Evaluation
When using ROC Curves and AUC, consider the nature of the problem and the context in which the model will be used. For example, in medical diagnostics, the cost of false negatives (missing a disease) might be higher than the cost of false positives (false alarms).
In such cases, focus on the ROC Curve, AUC, and other metrics that assess performance at specific thresholds, such as precision and recall, to ensure the model meets practical requirements.
Additionally, the ROC Curve and AUC should always be compared with other evaluation metrics for a holistic view of model performance. Metrics like confusion matrices, precision, recall, and F1 score can provide more insight into how well the model handles different errors.
Common Pitfalls and How to Avoid Them
When evaluating machine learning models using the ROC curve and AUC, several common pitfalls can lead to misinterpretation of results and suboptimal decision-making. Here are some of these pitfalls, along with strategies to avoid them:
Misinterpreting High AUC Values
One prevalent pitfall is interpreting a high AUC as a guarantee of a good model. While a high AUC indicates that the model can discriminate between classes effectively, it does not account for the distribution of classes or the practical implications of misclassifications.
How to Avoid This Pitfall:
- Combine AUC with Other Metrics: Use additional performance metrics such as precision, recall, F1-score, and accuracy to gain a more comprehensive understanding of the model’s performance. This multi-metric approach provides insights into how well the model performs across different aspects.
- Understand Trade-offs: Be aware of the trade-offs involved in model predictions. For instance, a model with high sensitivity may have lower specificity, which can be critical depending on the application. Assess the implications of these trade-offs in the context of your specific use case.
Over-Reliance on ROC Curve and AUC in Critical Decision Thresholds
Another common pitfall is over-relying on ROC curves and AUC in scenarios where the decision threshold is critical. In many applications, especially in healthcare or finance, the consequences of false positives and false negatives can vary significantly.
How to Avoid This Pitfall:
- Validate Performance Across Various Thresholds: Always evaluate the model’s performance at multiple thresholds rather than relying solely on the AUC. This helps identify the threshold that best balances sensitivity and specificity according to the specific requirements of the application.
- Use Precision-Recall Curves: In cases where class distributions are imbalanced, consider using precision-recall curves alongside ROC curves. Precision-recall curves focus on the performance of the positive class and can provide more meaningful insights in such scenarios.
3. Ignoring Class Imbalance
Many practitioners overlook the effects of class imbalance when interpreting ROC curves and AUC. A model may achieve a high AUC even in scenarios where it fails to predict the minority class effectively.
How to Avoid This Pitfall:
- Analyse Class Distribution: Before evaluating the model, examine the class distribution in your dataset. If there is significant imbalance, consider using techniques such as resampling, synthetic data generation, or adjusting class weights during model training.
- Focus on Relevant Metrics: When dealing with imbalanced datasets, focus on metrics that reflect the model’s performance on the minority class, such as F1-score, Matthews correlation coefficient, or area under the precision-recall curve (AUC-PR).
Neglecting the Context of the Application
Another pitfall is failing to consider the specific context of the application when interpreting ROC curves and AUC. The implications of misclassifications can vary widely depending on the domain.
How to Avoid This Pitfall:
Involve Domain Experts: Collaborate with domain experts to understand the practical implications of false positives and false negatives in your specific context. This collaboration can help you define the most relevant performance metrics and thresholds for your application.
Conduct Sensitivity Analysis: Perform sensitivity analyses to evaluate how changes in model parameters and thresholds impact outcomes. This can help you understand the robustness of your model and its performance in real-world scenarios.
Conclusion
Understanding the ROC Curve and AUC in Machine Learning is crucial for evaluating binary classification models. The ROC Curve visually represents the trade-off between True Positive and False Positive rates, while the AUC provides a single metric summarising overall performance.
These tools offer valuable insights into model effectiveness, particularly in imbalanced datasets, helping you select and refine models that best meet your needs.
Frequently Asked Questions
What is the ROC Curve in Machine Learning?
The ROC Curve (Receiver Operating Characteristic Curve) visualises a binary classification model’s performance. It plots the True Positive Rate (TPR) against the False Positive Rate (FPR) across various thresholds to evaluate the model’s ability to distinguish between classes.
How is AUC Related to the ROC Curve?
AUC (Area Under the Curve) quantifies a binary classifier’s overall performance. It measures the area under the ROC Curve, with values ranging from 0 to 1. Higher AUC values indicate better model performance and discrimination between positive and negative classes.
Why use ROC Curve and AUC for Model Evaluation?
ROC Curve and AUC provide a comprehensive view of model performance, especially in imbalanced datasets. They evaluate a model’s ability to balance sensitivity and specificity, offering insights beyond traditional metrics like accuracy, precision, and recall.
Authors
-

Written by:
Aashi VermaReviewed by:


