
Summary: Accuracy in Machine Learning measures correct predictions but can be deceptive, particularly with imbalanced or multilabel data. The blog explains the limitations of using accuracy alone. It introduces alternative metrics like precision, recall, F1-score, confusion matrices, ROC curves, and Hamming metrics to evaluate models, ensuring improved insights comprehensively.
Introduction
When you work with Machine Learning, accuracy is the easiest way to measure success. It tells you how often a model makes correct predictions, making it a popular choice. However, relying only on accuracy in Machine Learning can be misleading, especially in real-world situations. What if your data is unbalanced or errors have serious consequences?
In this blog, you’ll learn why accuracy isn’t always the best metric, its challenges, and when to use alternative metrics. By the end, you’ll understand how to evaluate Machine Learning models effectively, even without technical expertise.
Key Takeaways:
- Accuracy in Machine Learning is a widely used metric.
- Relying solely on accuracy can mislead evaluations.
- Imbalanced and multilabel data require alternative metrics.
- Precision, recall, and F1-score reveal deeper performance insights.
- Comprehensive evaluation improves model reliability and outcomes.
Accuracy in Machine Learning
Accuracy is a way to measure how well a Machine Learning model makes predictions. It tells us the percentage of correct predictions out of the total predictions made. A high accuracy means the model performs well, while a low accuracy indicates improvement.
The formula for accuracy is:
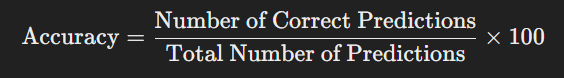
For example, if a model makes 100 predictions and 90 are correct, the accuracy is 90%.
Using Accuracy Score in Python
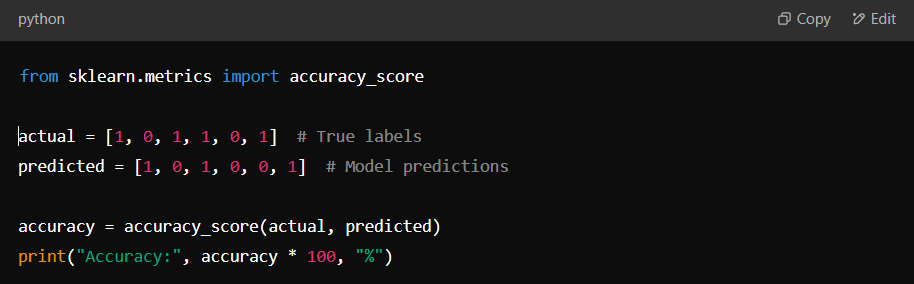
In Python, we can calculate accuracy using the accuracy_score function from the sklearn.metrics module. Here’s a simple example:
How Accuracy Works in Binary Classification
In binary classification, the model predicts one of two possible outcomes (e.g., “Yes” or “No”). Accuracy measures how often the model gets it right. However, accuracy alone may be insufficient if the data is imbalanced (one class appears much more often than the other). In such cases, additional metrics like precision and recall help evaluate performance better.
The Accuracy Paradox
The accuracy paradox happens when a model appears highly accurate but performs poorly in real-world situations. This occurs because accuracy, as a measure, does not always tell the full story of a model’s performance.
How Class Imbalance Affects Accuracy
Class imbalance means that one outcome occurs much more often than another. For example, in a cancer prediction model, most cases may be non-cancerous, while only a few cases are cancerous. If the model predicts “no cancer” for everyone, it may still show 98% accuracy. However, it completely fails to detect cancer in those who have it.
Example
Let’s consider a model trained to detect breast cancer using the Wisconsin Breast Cancer Dataset. Of 100 cases, 95 are benign (non-cancerous) and only 5 are malignant (cancerous). If the model predicts all cases as benign, it would be 95% accurate—but it would miss all cancer cases, which is dangerous.
Why High Accuracy Can Be Deceptive
In imbalanced datasets like cancer detection, accuracy alone is not a good measure. Other metrics like precision, recall, and F1-score help determine how well a model identifies actual cancer cases. Always look beyond accuracy to ensure a model makes meaningful predictions.
Alternatives to Accuracy for Model Evaluation

Accuracy is one of the most commonly used metrics to evaluate Machine Learning models. However, it is not always the best choice, especially when dealing with imbalanced datasets or situations where false positives or negatives carry significant consequences. Let’s explore when accuracy is not reliable and the better alternatives available.
When is Accuracy Not Reliable?
Accuracy measures the percentage of correctly predicted outcomes but does not consider the type of errors made by a model. For example, in medical diagnosis, a model that predicts “no disease” for everyone may still have high accuracy if most people are healthy. However, it fails to detect actual patients, which can have serious consequences.
Before relying on accuracy, ask yourself:
- Is the dataset imbalanced (more of one class than the other)?
- Are false positives or false negatives more critical in this case?
- Does accuracy truly reflect the model’s usefulness?
If the answer to these questions is “yes,” consider the following alternative metrics.
Precision: When False Positives Matter
Precision tells us how many of the predicted positive cases are correct. It is crucial in cases like spam detection, where marking an actual email as spam (false positive) can cause inconvenience.
Recall (Sensitivity): When Missing Positives is Costly
Recall measures how many actual positive cases were correctly identified. This is important in medical tests, where missing a patient with a disease (false negative) can have severe consequences.
F1 Score: Balancing Precision and Recall
The F1 score is a combination of precision and recall. It is useful when both false positives and false negatives need to be minimised, such as in fraud detection.
Confusion Matrix: Understanding Errors
A confusion matrix shows how a model classifies data, breaking down errors into false positives and false negatives. This helps in analysing where the model is going wrong.
ROC Curve & AUC: Measuring Trade-offs
The ROC curve shows the trade-off between correctly predicting positives (true positive rate) and incorrectly predicting negatives as positives (false positive rate). AUC (Area Under the Curve) measures the overall performance, with a higher value indicating a better model.
PR-Curve: Handling Imbalanced Data
The Precision-Recall (PR) curve is useful when one class is much smaller than the other, such as in rare disease detection. It shows how well a model distinguishes the minority class.
Matthews Correlation Coefficient: A Balanced Metric
This metric considers all four outcomes (true positives, true negatives, false positives, and false negatives) and provides a single value that works well even for imbalanced datasets.
Choosing the right evaluation metric ensures that your model performs well for its intended purpose rather than relying only on accuracy.
Accuracy in Multiclass Problems
Accuracy is a common way to measure how well a model predicts the correct answers. In multiclass classification, the model assigns each input to one of several categories. But is accuracy always the best way to measure performance? Let’s break it down step by step.
What is Accuracy in Multiclass Classification?
Accuracy is the percentage of correct predictions made by the model. It is calculated using this formula:
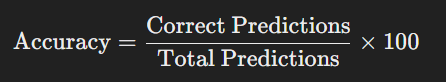
For example, if a model correctly predicts 80 out of 100 test cases, its accuracy is 80%.
Example: Confusion Matrix for a 3-Class Problem
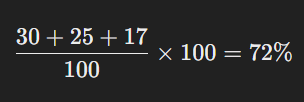
A confusion matrix helps us understand how a model performs. Let’s say we have three categories: A, B, and C. The table below shows a sample confusion matrix:
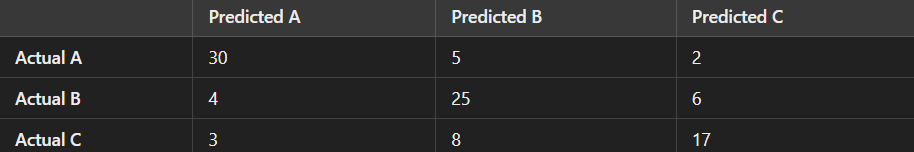
Here, the correct predictions are 30 (A), 25 (B), and 17 (C). The total number of cases is 100. So, accuracy is:
Case Study: Predicting the Iris Dataset with a Decision Tree
The Iris dataset contains flower measurements that classify flowers into three types: Setosa, Versicolor, and Virginica. A Decision Tree model analyses these measurements and makes predictions.
Suppose we train a model on this dataset and achieve 90% accuracy. This means the model predicts the correct flower type 90 times out of 100. However, does this mean the model is perfect? Not necessarily.
Why Class-Level Recall is More Informative
Sometimes, accuracy can be misleading. Imagine one class has way more examples than the others. The model might get high accuracy just by predicting the most common class more often.
Class-level recall tells us how well the model identifies each class separately. It shows if the model is unfairly favoring one class while ignoring others.
For example, in medical diagnosis, if a model predicts “no disease” for most patients, accuracy may be high, but it’s dangerous if real patients with diseases are missed. That’s why recall is often more critical in multiclass classification.
Would you trust a model that looks accurate or correctly identifies every class?
Accuracy in Multilabel Problems
When working with Machine Learning, it’s essential to understand the difference between multiclass and multilabel classification.
- Multiclass classification means that each data point belongs to only one category. For example, if you classify animals, an image can be a dog, a cat, or a bird—only one label applies.
- Multilabel classification allows each data point to belong to multiple categories simultaneously. For example, an image of a forest may have labels like “trees,” “river,” and “wildlife” all at once.
This key difference makes multilabel problems more complex because each item has more than one correct answer.
Challenges in Multilabel Settings
Since multilabel classification assigns multiple labels to a single data point, several challenges arise:
- Overlapping Labels – Some labels may frequently appear together, while others are rare. This imbalance can confuse the model.
- Correlated Labels – Some labels have strong relationships. For example, in news classification, “politics” and “government” often appear together.
- Standard Accuracy Issues – Traditional accuracy measures, like checking if the entire set of labels is correct, do not work well because they do not consider partial correctness.
Example Using the RCV1 Dataset
The RCV1 (Reuters Corpus Volume 1) dataset is a well-known collection of news articles, where each article can belong to multiple categories like “business,” “sports,” or “technology.” If we use a standard accuracy measure, an article with three correct labels but missing one might be marked incorrect, which is misleading.
Why Standard Accuracy is Misleading in Multilabel Problems
In multiclass classification, accuracy is simple: If the predicted label matches the actual label, it’s correct. But in multilabel classification, things are different.
For example, if an article has three correct labels, but the model predicts only two, should we say the entire prediction is wrong? Standard accuracy does this, which is unfair. We need a better way to measure performance that accounts for partial correctness.
Subset Accuracy (Exact Match Ratio) in Multi-Label Classification
Evaluating the model’s performance can be tricky when working with multi-label classification. Subset Accuracy is one of the strictest evaluation methods, also called the Exact Match Ratio. Let’s explore what it means, why it can be challenging, and better alternatives for evaluation.
What is Subset Accuracy?
Subset Accuracy measures how often a model correctly predicts the exact set of labels for a given input. It checks if all predicted labels perfectly match the actual labels. The entire prediction is considered wrong if even one label is incorrect or missing.
For example, imagine a model that identifies objects in images. If an image contains a cat, dog, and ball, and the model predicts cat and ball, the prediction is considered incorrect—even though it got two out of three labels right.
Challenges with Subset Accuracy
Subset Accuracy is very strict. In real-world scenarios, models rarely predict all labels with 100% accuracy, especially when dealing with complex data. This makes Subset Accuracy less practical because:
- It gives zero credit for partial correctness: A single mistake is a failure, even if most labels are correct.
- It is sensitive to small errors: A minor misclassification can drastically lower the score.
- It is not ideal for large label sets: Achieving perfect predictions is highly unlikely when there are many possible labels.
Due to these challenges, other evaluation metrics provide a more balanced view of a model’s performance.
Better Alternatives for Evaluating Multi-Label Models
Since Subset Accuracy can be too harsh, here are some better ways to measure how well a model performs:
Hamming Score
Hamming Score calculates the percentage of correctly predicted labels out of all labels. Unlike Subset Accuracy, it gives partial credit when some labels are correct.
For example, if the actual labels are cat, dog, ball, and the model predicts cat and ball, the Hamming Score considers this partly correct instead of entirely wrong.
Hamming Loss
Hamming Loss measures the number of incorrect label predictions. A lower Hamming Loss means a better-performing model. It helps identify how often mistakes happen rather than whether an entire set is correct or incorrect.
Precision, Recall, and F1 Score
These three metrics are commonly used for multi-label classification:
- Precision: Measures how many of the predicted labels are correct.
- Recall: Measures how many actual labels were correctly predicted.
- F1 Score: Balances Precision and Recall to give a single performance score.
Using these alternatives, you get a clearer and fairer evaluation of how well a model predicts multiple labels rather than just checking for an exact match.
Additional Accuracy Metrics

While accuracy is essential in evaluating a model’s performance, it doesn’t always give the whole picture. In some cases, like when dealing with imbalanced data or probability-based predictions, other accuracy metrics provide better insights. Let’s explore three key accuracy metrics:
Balanced Accuracy: Handling Imbalanced Datasets
Sometimes, datasets are imbalanced, meaning one category has far more examples than another.
For example, in a medical test for a rare disease, most results will be negative, making a simple accuracy score misleading. Balanced accuracy solves this problem by giving equal importance to common and rare cases.
It takes the average of two values: how well the model identifies positive cases and how well it identifies negative cases. This ensures a fair evaluation, even when one group is much larger than the other.
Top-K Accuracy: Useful for Recommendations and Image Recognition
Imagine searching for a movie recommendation. A system may suggest multiple movies, and the recommendation is helpful if at least one of them is what you like. This is where Top-K Accuracy comes in.
Instead of checking if the model’s top answer is correct, it checks if the correct answer appears within the top K (e.g., top 3 or top 5) predictions. This metric is critical in recommendation systems (like Netflix or Spotify) and image classification (where multiple objects may be in a photo).
Accuracy of Probability Predictions: Measuring Confidence in Predictions
Some models don’t just make a yes-or-no decision—they provide probabilities. For example, a weather app might say there’s a 70% chance of rain instead of just predicting “rain” or “no rain.”
We use Log Loss and Brier Score to check how well these probability-based models perform. Log Loss measures how close the predicted probabilities are to the actual outcomes, with lower values indicating better predictions. Brier Score does something similar but is easier to understand—lower scores mean more accurate probability estimates.
In The End
Ensuring the accuracy of a Machine Learning model is crucial for reliable predictions and decision-making. By employing techniques such as cross-validation, metrics like precision and recall, and visualizations like ROC curves, you can comprehensively evaluate your model’s performance.
Regularly testing and refining your model against diverse datasets helps maintain its accuracy over time. Implementing these strategies not only enhances model reliability but also fosters trust in AI-driven insights, leading to better business outcomes and more informed decision-making processes.
By prioritising model accuracy, you set the foundation for successful AI integration across various industries.
Frequently Asked Questions
What is Accuracy in Machine Learning, and Why is it Important?
Accuracy in Machine Learning calculates the proportion of correct predictions relative to total predictions. It offers an initial measure of model performance and is easy to interpret. However, accuracy may hide underlying issues in imbalanced datasets, making additional metrics necessary to assess a model’s effectiveness and reliability for full evaluation.
Why can Accuracy in Machine Learning be Misleading in Certain Scenarios?
Accuracy in Machine Learning can be misleading when data is imbalanced or errors carry high consequences. A model might achieve high accuracy by favoring a majority class while failing to detect minority cases. This oversight can hide deficiencies, emphasising the need to consider precision, recall, and other evaluation metrics.
What Alternative Metrics Should I Use Instead of Relying Solely on Accuracy in Machine Learning?
Instead of relying solely on accuracy in Machine Learning, consider using precision, recall, and F1-score to assess performance more thoroughly. Use confusion matrices, ROC curves, and balanced accuracy for imbalanced datasets. These alternative metrics provide deeper insights into errors, model reliability, and true performance across diverse scenarios for evaluation.
Authors
-

Written by:
Neha SinghReviewed by:


