Summary: Statistical analysis is a crucial tool for making informed decisions. It involves using various methods to summarise, analyse, and draw conclusions from data. From descriptive statistics to inferential statistics and predictive analytics, statistical analysis helps in understanding patterns, making predictions, and driving business outcomes.
Introduction
Statistics is an important part of Data Science where using Statistical Analysis, organisations can derive the value of the data input and evaluate meaningful conclusions. There are different types of statistical analysis techniques that are essential for application in various industries with a wide range of data.
Moreover, it is important to know the different methods of statistical Analysis and the ways to use them for exploring data, finding patterns and identifying market trends.
Read this blog to find out more about What is Statistical Analysis and the different types and methods of statistical Analysis.
What is Statistical Analysis?
Statistical Analysis refers to the procedure where business organisations make sense of large volumes of data and helps guide their decision-making process. It is performed on datasets where the analysis creates different types of output based on the input data.
For instance, statistical analysis can summarise data, derive the values from the input data, provide input data characteristics, prove a null hypothesis, etc. The output varies based on the method of Analysis.
Statistical Analysis is crucial for governmental organisations as well as business management professionals. Moreover, it helps the experts within an organisation understand the complexities involved in a business scenario and the association of the data.
Using statistical data, it is possible to generate information that derives political theory, campaign strategy and development of policies.
Types of Statistical Analysis

There are two main types of Statistical Analysis- Descriptive Statistics and Inferential Statistics. The explanation of these two types is given below:
Descriptive Statistics
The process of collecting, organising, analysing and summarising datasets and presenting them in an understandable form using graphs, charts and tables is known as Descriptive Statistics.
With Descriptive Statistics, it is possible to make large datasets presentable and eliminates major complexities for Data Analysts to analyse the data. The format of the summarised data can be quantitative or visual.
Inferential Statistics
With the help of inferential statistics, it is possible to determine the inference of a large population group. Inferential Statistics focuses on the Analysis and findings of the large sample data that is gained from a large population.
It makes the process cost-efficient and time-saving as well. Furthermore, it includes the development of interval estimates and points estimates for conducting Analysis.
Predictive Analysis
This analysis is useful for forecasting future events based on present and past data. Accordingly, it uses machine learning tools, data mining processes, big data, predictive modelling, artificial intelligence and simulations for Predictive Analysis.
Prescriptive Analysis
The Prescriptive Analysis helps in prescribing the best possible outcome for assessing datasets. Moreover, it helps make informed decisions and encourages efficient decision-making processes.
Exploratory Data Analysis
It studies datasets to highlight the major features of the data. Accordingly, the use of this type of Analysis is undertaken with statistical graphics or other visualisation approaches.
Causal Analysis
It analyses the issues of an event and identifies the reason behind them. Effectively, using Data Analytics, it is possible to analyse and find the reasons for unacceptable outcomes or failures in a business or business activities.
Basic Methods of Statistical Analysis
Here we will dig deeper into the fundamental methods of statistical analysis, including calculating mean, median, and mode, performing regression analysis, and conducting hypothesis testing. By mastering these techniques, you’ll be equipped to effectively analyse and interpret data, making informed decisions and driving business outcomes.
Mean
Calculating the mean involves finding the sum of all the numbers in a list and dividing the answer by the total number of items in the list. Effectively, it is one of the simplest forms of Statistical Analysis, which allows a user to determine the central point in a dataset. Accordingly, the formula for calculating the mean is:
Mean = Set of numbers/ number of items.
Standard Deviation
Standard Deviation is the method that helps determine how data can be spread around the mean, implying the dispersion of data points. Accordingly, a high standard deviation means that data dispersion is wider from the mean, and low standard Deviation implies that data is closer to the mean. To calculate standard Deviation, here is the formula you can use:
σ2 = Σ(x − μ)2/n
σ represents the Standard Deviation
Σ represents the sum of the data
x represents the value of the dataset
μ represents the mean of the data
n represents the number of data points in the population
Regression
Regression is the method in Statistical Analysis which helps in finding the relationship between a dependent and independent variable. Significantly, it helps in tracking the changes in one variable and how it affects the changes in another.
With the help of the regression method, it is possible to show whether the relationship between two variables is strong or weak or will vary over time. The regression formula is:
Y = a + b(x)
Where,
Y represents the independent variable
x represents the dependent variable
a represents the y-intercept or the value of y when x is equal to 0
b represents the slope of the regression graph.
Hypothesis Testing
Hypothesis Testing is the statistical analysis method where you test if a conclusion is valid for a specific dataset by comparing against a set of assumptions.
The test result can help nullify the hypothesis, in which case it becomes a null hypothesis or hypothesis 0. Additionally, anything that stands against or violates hypothesis 0 is the first hypothesis or hypothesis 1.
Statistical Analysis example using Mean Method
Statistical analysis involves the collection and interpretation of data to make informed decisions. One of the most basic and widely used methods in statistical analysis is the Mean Method. Here’s an example of how to calculate the mean of a data set:
Example: Calculating the Mean of a Data Set
Suppose we have the following data set: 24, 3, 15, 6, 2.
- Add the numbers together:
24+3+15+6+2=5024+3+15+6+2=50
2. Divide by the number of data points:
50÷5=1050÷5=10
Conclusion
The mean of this data set is 10.
Explanation
The mean is the average of all the data points in a set. It is calculated by adding all the data points and then dividing by the number of data points. This method is simple to understand and widely used in various fields, including finance, education, and research
Statistical Analysis Example using Regression Method
Statistical analysis involves the collection and interpretation of data to make informed decisions. One of the most widely used methods in statistical analysis is the Regression Method. Here’s an example of how to perform regression analysis:
Example: Simple Linear Regression
Suppose we want to understand the relationship between a company’s stock price (dependent variable) and the company’s quarterly earnings (independent variable). For several quarters, we collect historical data on the company’s earnings and stock prices.
- Collect Data:
- Stock Price (dependent variable)
- Quarterly Earnings (independent variable)
- Plot the Data:
- Create a scatter plot to visualize the relationship between the two variables.
- Calculate the Regression Line:
- Use the data to calculate the regression equation, which represents the best-fitting line through the data points.
- Interpret the Results:
- The regression line will provide an equation that can be used to predict future stock prices based on quarterly earnings.
Example Calculation
Suppose we have the following data:
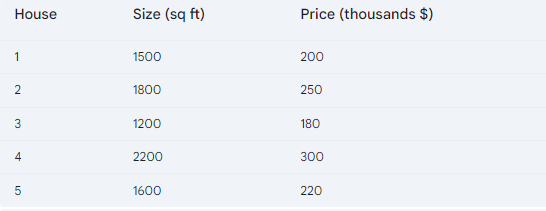
Model:
- Y = a + bX
- Y: Predicted price
- X: House size
- a: Intercept
- b: Slope
Calculations:
- Mean of X (x̄) = (1500 + 1800 + 1200 + 2200 + 1600) / 5 = 1660
- Mean of Y (ȳ) = (200 + 250 + 180 + 300 + 220) / 5 = 230
- ΣXY = 1500200 + 1800250 + 1200180 + 2200300 + 1600*220 = 1890000
- ΣX² = 1500² + 1800² + 1200² + 2200² + 1600² = 14100000
- ΣY² = 200² + 250² + 180² + 300² + 220² = 259000
- n = 5
- b = (nΣXY – ΣXΣY) / (nΣX² – (ΣX)²) = (51890000 – 16601150) / (5*1410000 – 1660²) = 0.08
- a = ȳ – bx̄ = 230 – 0.081660 = 76.8
Regression Equation:
- Price = 76.8 + 0.08 * Size
Interpretation:
- For every additional square foot of size, the price increases by $80.
- The base price of a house (with zero size) is $76,800.
Note: This is a simple example for illustrative purposes. In real-world scenarios, more complex models and statistical tests would be used.
Conclusion
Hence, Statistical Analysis is a crucial part of Data Science and the different types and methods of Statistical Analysis. Moreover, Data Scientists use different methods and techniques to analyse datasets within organisations where statistical inferences become important.
While it is not necessary for you to have a statistical background to become a Data Scientist or Data Analyst, developing statistical skills will only make you more efficient in the field.
Frequently Asked Questions
What are the Different Types of Statistical Analysis?
Statistical analysis can be categorized into three main types: descriptive statistics, inferential statistics, and predictive analytics. Descriptive statistics summarize data, inferential statistics make inferences about a population, and predictive analytics forecast future outcomes.
What are the Basic Methods of Statistical Analysis?
The basic methods of statistical analysis include calculating measures of central tendency (mean, median, mode), measures of dispersion (range, variance), and performing regression analysis to understand relationships between variables.
Can You Provide an Example of Statistical Analysis in Real-Life?
Yes, an example of statistical analysis in real-life is using regression analysis to understand the relationship between a company’s stock price and its quarterly earnings. By analysing historical data, companies can predict future stock prices and make informed investment decisions.
Authors
-

Written by:
Asmita KarReviewed by: