Summary: Seaborn and Matplotlib are two powerful Python libraries for data visualisation, each with unique strengths. Matplotlib offers extensive customisation and versatility, while Seaborn simplifies statistical plotting with attractive defaults. Understanding the differences between Seaborn vs Matplotlib helps data scientists choose the right tool for creating visualizations that effectively communicate insights.
Introduction
Data visualisation is a crucial aspect of Data Analysis, enabling researchers and analysts to interpret complex datasets and communicate findings effectively. In the Python ecosystem, two of the most prominent libraries for data visualisation are Matplotlib and Seaborn.
While both libraries serve the same overarching purpose, they have distinct features, strengths, and weaknesses that cater to different needs and preferences.
Visualising data is essential for understanding trends, patterns, and insights within datasets. Python, being a versatile programming language, offers several libraries for data visualisation, with Matplotlib and Seaborn being the most popular.
Matplotlib is the foundational library for creating static, animated, and interactive visualisations in Python. It provides a comprehensive toolkit for generating a wide variety of plots and charts. Seaborn, on the other hand, is built on top of Matplotlib and is designed to simplify the creation of attractive and informative statistical graphics.
It enhances Matplotlib’s capabilities by providing higher-level abstractions and improved aesthetics.
In this blog, we will explore the key features of both libraries, their differences, and how to choose the right one for your data visualisation needs.
What is Matplotlib?
Matplotlib is a widely used Python library for creating static, animated, and interactive visualisations. Developed by John D. Hunter in 2003, it has become the standard for data visualisation in Python. Matplotlib provides a flexible and comprehensive set of plotting capabilities, allowing users to create a wide range of charts, graphs, and plots.
Read More:
Key Features of Matplotlib:
- Versatility: Matplotlib can create various types of plots, including line plots, scatter plots, bar charts, histograms, and more.
- Customizability: It offers extensive customization options, allowing users to control every aspect of a plot, from the axes to the colour schemes.
- Integration: Matplotlib integrates well with other libraries, such as NumPy and Pandas, making it easy to visualise data stored in arrays or data frames.
- Interactive Plots: It supports interactive plotting, enabling users to create dynamic visualisations that can be embedded in applications.
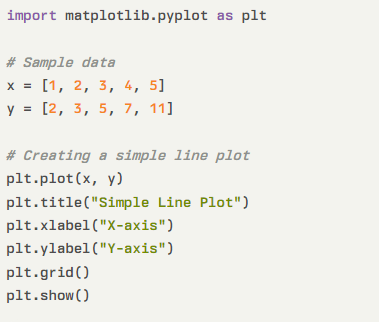
Basic Example of Matplotlib:
What is Seaborn?
Seaborn is a Python data visualisation library built on top of Matplotlib. It was developed by Michael Waskom and is particularly well-suited for statistical data visualisation. Seaborn simplifies the process of creating complex visualisations and enhances Matplotlib’s capabilities by providing attractive default styles and colour palettes.
Key Features of Seaborn:
- Statistical visualisation: Seaborn is designed for statistical data visualisation, making it easier to create informative plots that reveal relationships between variables.
- Built-in Themes: It comes with attractive default styles and colour palettes, allowing users to create visually appealing plots with minimal effort.
- High-Level Abstractions: Seaborn provides higher-level functions that simplify the creation of complex visualisations, such as heatmaps, violin plots, and pair plots.
- Integration with Pandas: Seaborn works seamlessly with Pandas data frames, enabling users to create plots directly from data frames without extensive data manipulation.
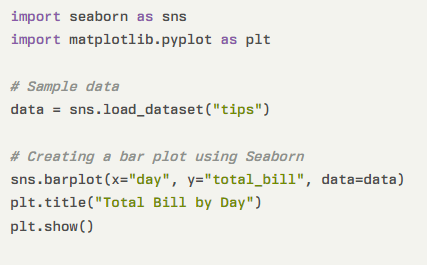
Basic Example of Seaborn:
Enhance your knowledge in Python by clicking on this link.
Key Differences Between Seaborn and Matplotlib
While both Seaborn and Matplotlib are powerful tools for data visualisation, they differ in several key aspects:
Level of Abstraction
The level of abstraction in data visualisation libraries affects usability and complexity. Seaborn provides higher-level abstractions for easier plotting, while Matplotlib offers more granular control for detailed customization and flexibility.
- Matplotlib: It is a low-level library that provides fine-grained control over individual elements of a plot. This flexibility allows for extensive customization but often requires more code.
- Seaborn: Seaborn is a high-level library that abstracts some complexities, making it easier to create complex statistical plots with less code.
Aesthetics
Aesthetics play a vital role in data visualisation, influencing how effectively information is communicated. Seaborn prioritises attractive default styles, while Matplotlib requires more customization to achieve visually appealing plots.
- Matplotlib: By default, Matplotlib’s plots have a utilitarian look, and creating visually appealing plots often requires additional customization.
- Seaborn: Seaborn emphasises aesthetics, providing beautiful default styles and colour palettes that make plots visually appealing without much effort.
Specialised Plots
Seaborn offers specialised plots that go beyond basic visualisations, enabling users to uncover complex relationships and patterns in data. These plots combine elements of categorical and statistical graphics for deeper insights.
- Matplotlib: While it can create various types of plots, some specialised plots may require more effort to implement.
- Seaborn: Seaborn specialises in statistical visualisations and offers built-in functions for creating plots like violin plots, box plots, and pair plots, which are more challenging to create in Matplotlib.
Plotting Basics
Plotting basics provide the foundation for creating visualisations using Seaborn and Matplotlib. Understanding fundamental concepts, syntax, and functions is essential for effectively representing data and communicating insights visually.
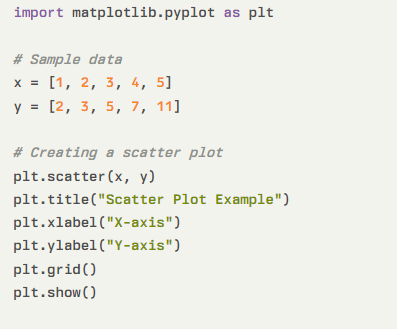
Matplotlib Plotting Basics
Creating a basic plot in Matplotlib involves importing the library, defining the data, and calling the appropriate plotting function. Here’s a simple example of creating a scatter plot:
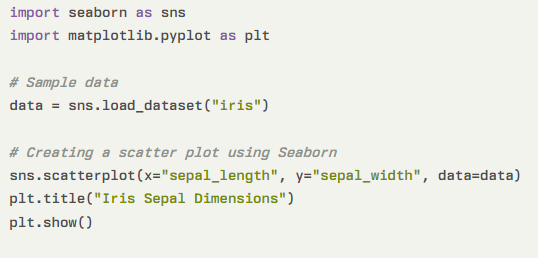
Seaborn Plotting Basics
Seaborn simplifies the plotting process significantly. For instance, creating a scatter plot can be done with just one line of code:
Statistical Plots
Statistical plots are essential for data analysis, revealing relationships, trends, and patterns within datasets. Seaborn excels in creating informative statistical graphics, while Matplotlib offers flexibility in customising statistical visualisations.
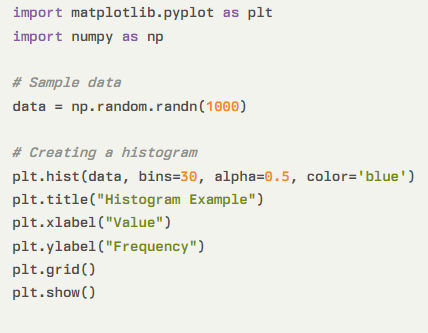
Matplotlib Statistical Plots
Matplotlib can create statistical plots, but it often requires manual calculations and additional code. For example, creating a histogram involves specifying the number of bins and customising the appearance:
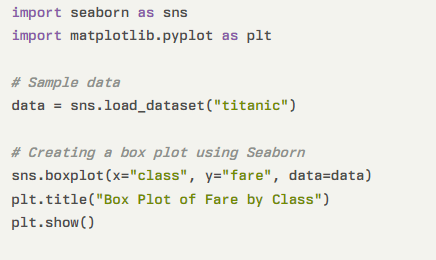
Seaborn Statistical Plots
Seaborn excels in creating statistical plots with built-in functions. For instance, creating a box plot is straightforward:
Customisation and Flexibility
Customisation and flexibility are key features of both Seaborn and Matplotlib. Users can tailor visualisations extensively, adjusting aesthetics, styles, and elements to meet specific needs and enhance data presentation effectively.
Customisation in Matplotlib
Matplotlib offers extensive customization options, allowing users to modify nearly every aspect of a plot. This includes changing colours, fonts, line styles, and more. However, this flexibility often requires more code and can be time-consuming.
Customization in Seaborn
Seaborn also allows for customization but focuses on providing aesthetically pleasing defaults. Users can easily change themes, palettes, and other visual elements without extensive coding. For example, changing the colour palette in Seaborn is as simple as:
Handling Data
Handling data is a crucial aspect of data visualisation. Seaborn simplifies the process by seamlessly integrating with Pandas data frames, while Matplotlib works with various data formats, including NumPy arrays and Pandas data frames.
Data Handling in Matplotlib
Matplotlib can work with various data formats, including NumPy arrays and Pandas data frames. However, users may need to manipulate the data before plotting, especially for complex visualisations.
Data Handling in Seaborn
Seaborn is designed to work seamlessly with Pandas data frames, making it easier to create visualisations directly from structured data. It simplifies the process of plotting categorical and grouped data, allowing users to focus on analysis rather than data manipulation.
Advanced Visualisations
Advanced visualisations require libraries with robust capabilities. Seaborn and Matplotlib offer functions for creating complex plots, such as heatmaps and 3D plots, enabling users to uncover insights from multidimensional data effectively.
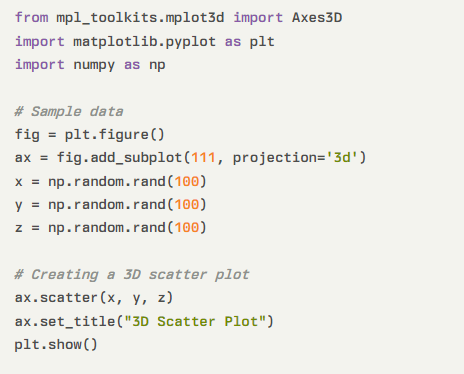
Advanced visualisations with Matplotlib
While Matplotlib can create advanced visualisations, it often requires more effort and code. For instance, creating a 3D plot involves importing additional modules and specifying the projection:
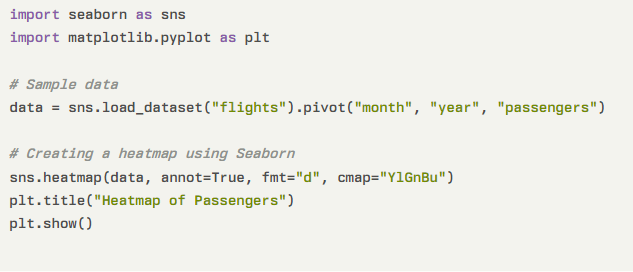
Advanced visualisations with Seaborn
Seaborn simplifies the creation of advanced visualisations, such as heatmaps and pair plots. For example, creating a heatmap is straightforward:
Performance Considerations
Performance considerations are crucial when choosing between Seaborn and Matplotlib for data visualisation. Understanding their efficiency, rendering speed, and handling of large datasets can significantly impact your visualisation workflow.
Performance of Matplotlib
Matplotlib is generally efficient for creating a wide range of plots, but performance may vary depending on the complexity of the visualisation and the size of the dataset. For very large datasets, rendering time may increase.
Performance of Seaborn
Seaborn is built on top of Matplotlib, so its performance is similar. However, because Seaborn simplifies the creation of complex visualisations, it can lead to faster development times, even if the rendering speed is comparable.
Integration with Other Libraries
Integration with other libraries is essential for enhancing data visualisation capabilities. Both Seaborn and Matplotlib seamlessly work with popular libraries like Pandas and NumPy, streamlining data manipulation and analysis processes.
Matplotlib Integration
Matplotlib integrates well with various libraries, including NumPy for numerical operations and Pandas for data manipulation. This integration allows users to create visualisations directly from data structures without extensive preprocessing.
Seaborn Integration
Seaborn is designed to work seamlessly with Pandas data frames, making it an excellent choice for Data Analysis tasks. It also integrates well with other libraries, such as StatsModels for statistical modelling, enhancing its capabilities for statistical visualisations.
Conclusion
Both Seaborn and Matplotlib are powerful libraries for data visualisation in Python, each with its unique strengths and weaknesses. Matplotlib provides a solid foundation for creating a wide range of plots with extensive customization options, making it suitable for users who require fine-grained control over their visualisations.
On the other hand, Seaborn simplifies the process of creating attractive and informative statistical graphics, making it an excellent choice for those focused on statistical analysis and quick exploration of data.Ultimately, the choice between Seaborn and Matplotlib depends on your specific needs, preferences, and the complexity of the visualisations you wish to create.
Many data scientists and analysts find value in using both libraries, leveraging the strengths of each to produce compelling visualisations that effectively communicate insights from their data.
Frequently Asked Questions
Can I Use Seaborn Without Matplotlib?
No, Seaborn is built on top of Matplotlib and relies on it for rendering plots. However, you can use Seaborn’s high-level functions to create visualisations without directly using Matplotlib functions.
Which Library is Better for Beginners, Seaborn or Matplotlib?
Seaborn is generally considered more beginner-friendly due to its simpler syntax and attractive default styles. It allows users to create complex visualisations with less code compared to Matplotlib.
Can I Customise Plots Created with Seaborn?
Yes, while Seaborn provides attractive default styles, you can still customise plots extensively using Matplotlib functions. Seaborn integrates seamlessly with Matplotlib, allowing for additional customisation options.
Authors
-

Written by:
Aashi VermaReviewed by: