Summary: Roll Rate Analysis is a vital financial tool for tracking transitions between credit stages, which is crucial in banking and finance. It empowers proactive risk management, aids decision-making, optimises portfolios, and guides strategic planning. Businesses gain insights into customer behaviour and financial dynamics by calculating transition rates and visualising data.
Introduction
Roll Rate Analysis is a pivotal financial metric for dissecting transitions between credit stages over a specified duration. Particularly prominent in banking and finance, this analytical method illuminates customer behaviour, risk management strategies, and decision-making processes.
Through meticulous calculation and interpretation, Roll Rate Analysis empowers businesses to anticipate risks, optimise portfolios, and make informed decisions in a dynamic financial landscape.
This comprehensive blog delves into the significance, calculation methods, practical examples, and implementation across various platforms, from Excel to Python. It offers a roadmap for mastering Roll Rate Analysis and harnessing its potential for proactive risk management and strategic decision-making.
Understanding What is Roll Rate Analysis
At its core, Roll Rate Analysis tracks the movement of accounts across predefined credit stages, such as delinquency levels or payment statuses. This dynamic evaluation enables businesses and financial institutions to understand how accounts progress or regress over time.
Significance of Roll Rate Analysis
Let’s explore the significance of Roll Rate Analysis in detail, understanding how it serves as a proactive tool for risk mitigation, empowers decision-making processes, aids in portfolio optimisation, and offers a strategic lens for effective strategic planning in the dynamic realm of finance.
Risk Mitigation
Roll Rate Analysis serves as a proactive tool for risk mitigation. By closely monitoring account transitions, businesses can identify potential risks early on, allowing for the implementation of strategic measures to mitigate and manage these risks effectively.
Decision-Making Empowerment
In the fast-paced world of finance, timely and well-informed decisions are critical. Roll Rate Analysis empowers decision-makers by providing granular insights into customer behaviour. This data-driven approach enhances decision-making, enabling businesses to confidently adapt to changing financial landscapes.
Portfolio Management
Effective portfolio management relies on a deep understanding of account dynamics. Roll Rate Analysis aids in portfolio optimisation by revealing patterns and trends within credit stages. This information is invaluable for fine-tuning portfolios, identifying areas of improvement, and maximising overall portfolio performance.
Strategic Planning
Strategic planning is a cornerstone of successful businesses. Roll Rate Analysis offers a strategic lens, allowing organisations to plan and adapt based on real-time data. This foresight is crucial for navigating uncertainties and positioning the business for sustained growth.
Also Read:
Role of Data Analytics in the Finance Industry.
How to Build a Data Analyst Portfolio?
Roll Rate Calculation
Let’s explore in detail how Roll Rate Analysis unfolds. Starting with defining credit stages, gathering comprehensive data sets, calculating transition rates, and culminating in graphical representation, each step is crucial for gaining insights into account dynamics over time.
Define Credit Stages
Clearly outline the credit stages relevant to your analysis. These stages typically include various levels of delinquency, ranging from current and 30 days overdue to more severe statuses. Establishing clear distinctions between these stages forms the foundation for accurate Roll Rate Analysis.
Gather Data
Accumulate comprehensive datasets that encompass transitions between credit stages over a defined period. This dataset should include customer account information, payment history, and relevant factors influencing credit movement. The richness of your data directly correlates with the depth of insights gained from the Roll Rate Analysis.
Calculate Transition Rates
Utilise the gathered data to compute transition rates between credit stages. Transition rates represent the percentage of accounts moving from one stage to another within a specific timeframe. The formula for calculating transition rates is straightforward:
Transition Rate = Number of Accounts Transitioned/Total Number of Accounts in Previous Stage×100
Repeat this calculation for each credit stage transition, providing a comprehensive view of how accounts progress or regress over time.
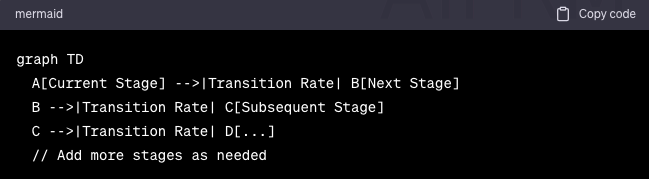
Graphical Representation
Enhance understanding and interpretation with a graphical representation of the Roll Rate Analysis. Consider using Mermaid Syntax to create a visual diagram illustrating the transitions and associated rates. This graphical representation is a powerful tool for conveying complex information in a digestible format, aiding in identifying patterns and trends.
Also, Check Out:
Data Replication: Ensuring Data’s Vitality in Distributed Systems.
Top Applications of Big Data across Industries.
Roll Rate Analysis Calculation: A Comprehensive Guide
Roll Rate Analysis systematically calculates the transition rates between different credit stages, providing valuable insights into the movement of accounts over time. Here’s a step-by-step guide on how to perform Roll Rate Analysis:
Define Credit Stages
Begin by clearly defining the credit stages relevant to your analysis. These stages typically include various levels of delinquency, such as “Current,” “30 Days Overdue,” “60 Days Overdue,” and so forth. Each stage represents a distinct point in the credit lifecycle.
Gather Data
Collect comprehensive data sets that capture the transitions of accounts between the defined credit stages. The data should include information on account identifiers, timestamps, and the current and subsequent credit stages for each account.
Calculate Transition Rates
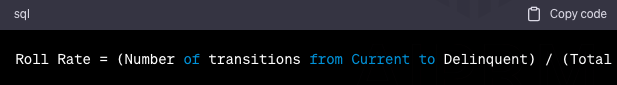
Use the gathered data to calculate the transition rates between credit stages. If you are thinking, what is the roll rate analysis formula? Then, The formula for calculating the transition rate from one stage to another is:
Roll Rate = Total Number of Accounts/ Number of Transitions
What is the Transition Rate?
Number of Accounts Transitioned to Next Stage/Total Number of Accounts in Current Stage × 100
Repeat this calculation for each relevant credit stage transition. This process provides a series of transition rates that indicate the percentage of accounts moving from one stage to the next within the specified time frame.
Aggregate and Visualise
Aggregate the calculated transition rates to gain a holistic view of the overall Roll Rate Analysis. Utilise visualisation tools, such as charts or graphs, to present the data in a clear and understandable format. Visual representations enhance the interpretation of trends and patterns within the roll rates.
Example Calculation:
Suppose you are analysing the transition from the “Current” stage to the “30 Days Overdue” stage. If, out of 500 accounts in the “Current” stage, 20 transitions to the “30 Days Overdue” stage, the calculation would be:
Transition Rate
20/500*100= 4%
Repeat this process for each credit stage transition relevant to your analysis.
Roll Rate Analysis in Data Science: Practical Examples
Roll Rate Analysis is a powerful tool in Data Science, providing actionable insights into patterns and trends within financial data. Here are real-world examples showcasing how it is applied in Data Science:
Credit Risk Modeling
Data Scientists leverage Roll Rate Analysis to assess borrowers’ transitions between different risk categories in credit risk modelling. Predictive models can be developed by analysing the roll rates between “low-risk” and “high-risk” segments over time.
These models help financial institutions anticipate shifts in creditworthiness, enabling them to make informed lending decisions and proactively manage potential defaults.
Customer Churn Prediction
Roll Rate Analysis predicts customer churn within subscription-based services. Data Scientists analyse the roll rates of customers transitioning from “active” to “churned” status.
This analysis enables businesses to identify factors contributing to customer attrition, allowing them to implement targeted retention strategies and enhance customer satisfaction.
Fraud Detection in Financial Transactions
Data Science is crucial in fraud detection, and Roll Rate Analysis is a key component. By examining roll rates between legitimate and fraudulent transactions, Data Scientists can identify anomalous patterns.
For example, a sudden increase in the roll rate from “normal” to “suspicious” transactions may indicate potential fraudulent activity. This insight facilitates the development of robust fraud detection algorithms to protect financial systems.
Portfolio Management in Investment Firms
Roll Rate Analysis aids Data Scientists in optimising investment portfolios. By scrutinising the roll rates of different assets or investment classes, they can identify trends in performance and potential risks. This analysis guides investment strategies, helping firms allocate resources effectively, maximise returns, and minimise exposure to market fluctuations.
Insurance Claim Analysis
In the insurance industry, Data Scientists apply Roll Rate Analysis to assess the progression of insurance claims through various stages. By analysing roll rates between the “submitted” and “settled” stages, they gain insights into the efficiency of the claims processing pipeline.
This analysis informs process improvements, ensuring timely settlements and enhancing customer satisfaction.
Loss Forecasting
Loss forecasting acts as a predictive tool. Imagine a dynamic landscape where the transitions between credit states are like shifting tides. The roll rate model for loss forecasting analyses these ebbs and flows and helps anticipate and navigate potential financial storms, providing a strategic map for effective loss forecasting.
Check Out More:
5 Common Data Science Challenges and Effective Solutions.
Inferential Statistics to Boost Your Career in Data Science.
Roll Rate Analysis in Excel
The significance of Roll Rate Analysis in Excel lies in its ability to provide insights into credit state transitions, aiding risk assessment and informed decision-making efficiently. Now, you will examine how to conduct this analysis in Excel.
Data Setup
Assume you have a dataset with columns representing credit states, such as “Account ID,” “Current,” and “Delinquent.”
Calculate Roll Rates
Create a new column for each transition, e.g., “Current to Delinquent Roll Rate.”
Use the formula
Example
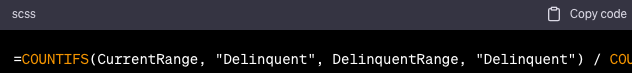
Interpretation
This formula calculates the roll rate from “Current” to “Delinquent.” Repeat for other transitions.
Visualise Results
Use charts or pivot tables to visualise trends and patterns in your roll rate data.
This Excel-based analysis offers insights into credit state transitions, aiding risk assessment and decision-making.
Must Read:
MIS Report in Excel? Definition, Types & How to Create.
Creating Waterfall Chart in Excel: Step-by-Step Tutorial.
Roll Rate Analysis in Python
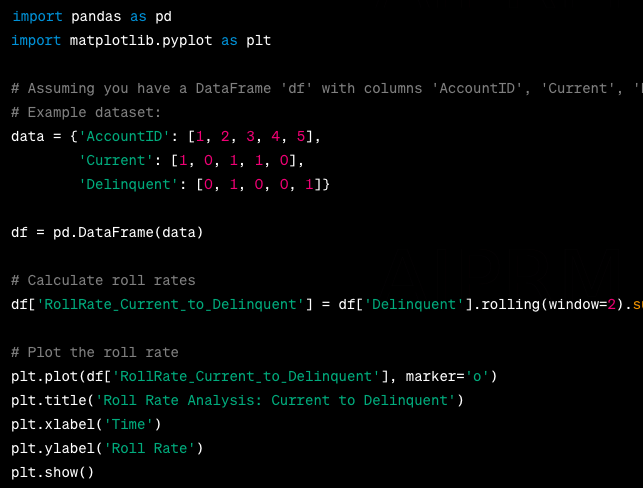
In this example, the rolling function calculates the rolling sum of transitions from “Current” to “Delinquent” divided by the rolling sum of “Current.” This gives you the roll rate over time. Adjust the column names and window size according to your dataset and analysis requirements.
Also Read:
Anaconda vs Python: Unveiling the differences.
Frequently Asked Questions
What is roll analysis?
Roll analysis examines the movement or turnover of specific variables over time, offering insights into trends and patterns. In finance, it often refers to evaluating changes in portfolio metrics.
What is the roll rate model of a portfolio?
The roll rate model assesses the transition between different credit or performance states within a portfolio, providing a dynamic view of risk and potential future trends.
What is roll rate analysis in banking?
Roll rate analysis in banking involves evaluating changes in specific financial metrics over time, such as delinquency or default rates. By tracking transitions between different credit states, banks gain insights into the performance of their portfolios to ensure effective risk management and informed decision-making.
Highlight the differences between roll rate and flow rate.
Roll rate is the percentage or ratio at which something changes or transitions over a specific period. It is commonly used in finance for credit risk management. Flow rate measures the quantity of a substance that moves through a particular space in a given amount of time. It is widely used in fluid dynamics and other industries.
What is the roll rate in a Markov chain?
In Markov chain analysis, roll rate signifies the probability of transitioning from one state to another in sequential events. It helps model and predict the system’s future behaviour based on its current state.
Wrapping It Up
Mastering Roll Rate Calculation involves a meticulous approach, from defining credit stages to creating visual representations. This guide provides a comprehensive framework for conducting Roll Rate Analysis, enabling businesses to make informed decisions and proactively manage risks in their financial portfolios.
The ever-expanding world of Data Science encompasses several concepts and formulas that make predictions accurate and precise. Expertise in this domain will open up growth prospects.
If you, too, want to become a pro in Data Science, join the Data Science courses by Pickl.AI. These courses include all the fundamental concepts of Data Science, making learning more accessible and more straightforward. To learn more, log on to Pickl.AI.
Authors
-

Written by:
Neha SinghReviewed by: