Summary: This blog explains the differences between one-way ANOVA vs two-way ANOVA, their definitions, assumptions, and applications. Learn when to use each method, how to perform them step-by-step, and real-world examples. Whether analysing one factor or two, this guide simplifies complex statistical concepts for researchers and Data Analysts.
Introduction
As someone who’s always fascinated by Data Analysis, I’ve often found myself pondering the best ways to compare group means and understand how different factors influence outcomes. In my journey through statistics, I’ve come to appreciate the power of ANOVA (Analysis of Variance), particularly in distinguishing between one way ANOVA and two way ANOVA.
Let’s consider a personal example: Imagine you’re a marketing manager trying to understand how different advertising strategies impact sales. If you’re comparing sales figures across three distinct strategies—social media, TV ads, and print media—a one-way ANOVA would be perfect for determining if there’s a significant difference in sales generated by each strategy.
However, if you also want to consider how these strategies perform differently based on customer demographics (e.g., age), a two-way ANOVA would allow you to explore both the individual effects of advertising strategy and demographic, as well as their interaction. This nuanced approach can reveal insights that might otherwise go unnoticed.
Key Takeaways
- One-way ANOVA analyses the effect of one independent variable on a dependent variable.
- Two-way ANOVA evaluates two independent variables and their interaction effects on a dependent variable.
- Use one-way ANOVA for simpler tests with one factor and three or more groups
- Two-way ANOVA is ideal for multifactorial analysis involving interactions between variables.
- Both methods require assumptions like normality, independence, and homogeneity of variances for accuracy.
Understanding One-Way ANOVA: Definition and Applications
One-way ANOVA is a statistical test used to determine whether there are significant differences between the means of three or more independent groups based on one independent variable. It’s particularly useful when you need to test a single factor’s effect on a dependent variable.
Applications of One-Way ANOVA
One-way ANOVA is commonly used in:
- Education: Comparing test scores across different teaching methods.
- Healthcare: Analysing the effectiveness of three or more treatments.
- Marketing: Evaluating customer satisfaction across multiple brands.
For example, let’s say you want to compare the average sales revenue generated by three advertising strategies (social media, TV ads, and print media). A one-way ANOVA can help determine if the revenue differences are statistically significant.
When Should You Use One-Way ANOVA?
Use one-way ANOVA when:
- You have one independent variable with at least three levels (e.g., three different treatments).
- Your dependent variable is continuous (e.g., height, weight, sales).
- You aim to test whether group means differ significantly.
If you only need to compare two groups, a t-test would suffice instead.
Key Assumptions of One-Way ANOVA
Before performing one-way ANOVA, ensure these assumptions are met:
- Independence: Observations must be independent of each other.
- Normality: The dependent variable should follow a normal distribution in each group.
- Homogeneity of Variance: The variance among groups should be approximately equal.
Violating these assumptions can lead to inaccurate results.
Step-by-Step Guide to Performing One-Way ANOVA
One-way ANOVA is a statistical method used to compare the means of three or more independent groups to determine whether there are significant differences among them. Below is a detailed, step-by-step guide to performing one-way ANOVA:
Step 1: Understand the Hypotheses
- Null Hypothesis (H0H0): All group means are equal.
- Alternative Hypothesis (HaHa): At least one group mean differs significantly from the others.
For example, if you are comparing the effectiveness of three different teaching methods (A, B, and C) on student performance, the null hypothesis assumes that all methods yield the same average performance.
Step 2: Check Assumptions
Before conducting one-way ANOVA, ensure your data meets these assumptions:
- Independence: Observations in each group must be independent of each other.
- Normality: The dependent variable should follow a normal distribution within each group.
- Homogeneity of Variance: Variances across groups should be approximately equal.
If these assumptions are violated, consider alternative methods like non-parametric tests or transformations.
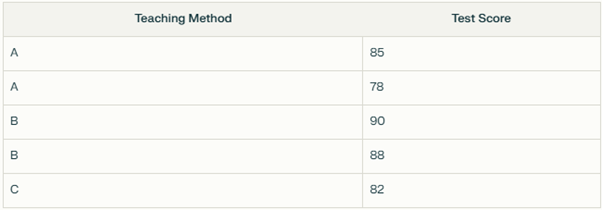
Step 3: Organise Your Data
Structure your data with:
- One categorical independent variable (e.g., teaching method with levels A, B, and C).
- One continuous dependent variable (e.g., test scores).
For Example:
Step 4: Calculate Group Means and Variance
- Compute the mean for each group to summarise central tendencies.
- Calculate the overall mean of all observations combined.
Step 5: Partition Variance
Divide the total variance into:
- Between-Group Variance (SSB): Variance due to differences between group means.
- Within-Group Variance (SSW): Variance within individual groups (random error).
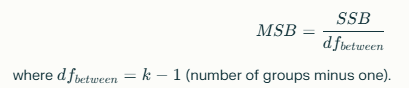
Step 6: Compute Mean Squares
Calculate the mean squares:
- Mean Square Between Groups (MSBMSB):
Mean Square Within Groups (MSWMSW):
MSW=SSWdfwithin

Step 7: Calculate F-Statistic
The F-statistic is computed as:
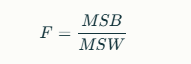
This value determines whether the variation between group means is greater than within-group variation.
Step 8: Compare F-Statistic with Critical Value
Using an F-distribution table and your degrees of freedom (dfbetweendfbetween and dfwithindfwithin), find the critical F-value at your chosen significance level (e.g., α=0.05α=0.05).
- If FF-statistic > critical FF-value, reject the null hypothesis (H0H0).
- Otherwise, fail to reject H0H0.
Step 9: Interpret Results
If you reject H0H0, it indicates that at least one group mean differs significantly. However, one-way ANOVA does not specify which groups differ—this requires a post-hoc test like Tukey’s HSD.
Real-World Example of One-Way ANOVA
Imagine a study comparing crop yields using three types of fertilisers (A, B, C). The dependent variable is crop yield (measured in kilograms). After conducting a one-way ANOVA, researchers find that fertiliser B significantly outperforms A and C, providing actionable insights for agricultural practices.
Exploring Two-Way ANOVA: Definition and Purpose
Two-way ANOVA extends one-way ANOVA by analysing the effects of two independent variables on a dependent variable simultaneously. It also evaluates whether there’s an interaction effect between the two factors.
Purpose of Two-Way ANOVA
Two-way ANOVA answers questions like:
- Do two factors independently affect the dependent variable?
- Does their combination produce an interaction effect?
For example, you might study how both gender (male/female) and exercise type (yoga/cardio/weights) influence weight loss.
When Is Two-Way ANOVA the Right Choice?
Use two-way ANOVA when:
- You have two independent variables, each with multiple levels.
- You want to test both main effects (individual impact of each factor) and interaction effects (combined impact).
- Your dependent variable is continuous.
Essential Assumptions of Two-Way ANOVA
Two-way ANOVA shares similar assumptions with one-way ANOVA:
- Observations must be independent.
- The dependent variable should follow a normal distribution.
- Homogeneity of variances across groups.
- Each group should have equal sample sizes for accurate results.
How to Conduct Two-Way ANOVA: A Detailed Approach
Two-way ANOVA is a statistical method used to examine the effects of two independent variables on a single dependent variable, as well as the interaction between these variables.
This test is particularly useful when you want to determine whether the combined influence of two factors has a significant impact on the outcome. Below is a step-by-step guide to performing a two-way ANOVA.
Step 1: Understand the Hypotheses
In two-way ANOVA, you test three hypotheses:
- Main Effect of Factor A: Does the first independent variable significantly affect the dependent variable?
- Main Effect of Factor B: Does the second independent variable significantly affect the dependent variable?
- Interaction Effect (A × B): Do the two independent variables interact to influence the dependent variable?
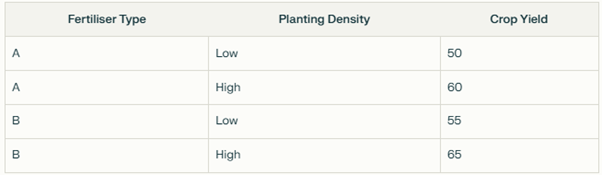
For example, if you’re studying how fertiliser type (Factor A) and planting density (Factor B) affect crop yield (dependent variable), you might ask:
- Does fertiliser type alone affect yield?
- Does planting density alone affect yield?
- Do fertiliser type and planting density interact to influence yield?
Step 2: Check Assumptions
Before conducting a two-way ANOVA, ensure your data meets these assumptions:
- Independence: Observations must be independent of each other.
- Normality: The dependent variable should follow an approximately normal distribution for each combination of factors.
- Homogeneity of Variance: Variances across groups should be equal. Use Levene’s test to check this assumption.
- Sufficient Sample Size: Each group should have enough observations to calculate reliable means.
Step 3: Organise Your Data
Set up your dataset with:
- Two categorical independent variables (e.g., fertiliser type and planting density).
- One continuous dependent variable (e.g., crop yield).
For example:
Step 4: Visualise the Data
Before performing calculations, visualise your data using boxplots or interaction plots. This helps identify trends and potential interactions between factors.
Step 5: Calculate Sum of Squares (SS)
Partition the total variability in your data into:
- SS for Factor A: Variability due to the first independent variable.
- SS for Factor B: Variability due to the second independent variable.
- SS for Interaction (A × B): Variability due to the combined effect of both factors.
- SS Within Groups (Error): Variability within individual groups.
The total sum of squares (SSTotalSSTotal) is calculated as:

Step 6: Calculate Degrees of Freedom (df)
Determine degrees of freedom for each source of variation:
- dfA=kA−1dfA=kA−1 (where kAkA is the number of levels in Factor A).
- dfB=kB−1dfB=kB−1 (where kBkB is the number of levels in Factor B).
- dfAB=dfA×dfBdfAB=dfA×dfB.
- dfWithin=N−kA×kBdfWithin=N−kA×kB (where NN is the total number of observations).
Step 7: Compute Mean Squares (MS)
Calculate mean squares by dividing each sum of squares by its corresponding degrees of freedom:
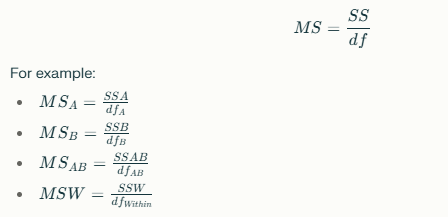
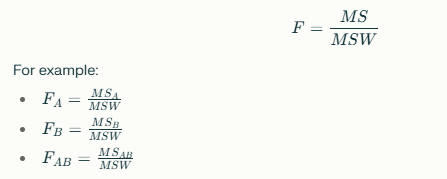
Step 8: Calculate F-Values
Compute F-values for each source of variation:
Step 9: Find p-values
Compare each F-value to its critical value from an F-distribution table or use statistical software to calculate p-values. If p-values are less than your significance level (e.g., 0.05), reject the null hypothesis for that factor or interaction.
Step 10: Interpret Results
Based on your findings:
- If Factor A or Factor B has a significant main effect, it means that factor independently influences the dependent variable.
- If there’s a significant interaction effect, it indicates that the two factors work together to influence the outcome.
For example, you might find that planting density significantly affects crop yield, but its effect depends on which fertiliser type is used.
Practical Example of Two-Way ANOVA in Action
Suppose researchers examine how diet type (vegetarian/non-vegetarian) and exercise frequency (low/medium/high) influence cholesterol levels. A two-way ANOVA reveals that both factors significantly affect cholesterol independently, but their interaction also plays a role—frequent exercise reduces cholesterol more effectively in vegetarians than non-vegetarians.
The choice between one-way and two-way ANOVA depends on your research question—whether you’re examining one factor or multiple factors simultaneously.
Conclusion
In summary, both one-way ANOVA and two-way ANOVA are powerful tools for analysing data when comparing group means across categories. While one-way ANOVA focuses on a single factor’s impact, two-way ANOVA evaluates two factors simultaneously along with their interactions.
For industry-specific analysis:
- Use one-way ANOVA for simpler studies like comparing product performance across regions.
- Opt for two-way ANOVA when exploring multifactorial influences like marketing strategies combined with demographics.
Understanding these techniques equips researchers with robust methods to uncover meaningful insights from data.
Frequently Asked Questions
What Is the Difference Between One-Way and Two-Way ANOVA?
The key difference lies in the number of independent variables: one-way ANOVA analyses one factor’s impact on a dependent variable, while two-way analyses two factors along with their interaction effects.
What Is the First Step in Performing a One-Way ANOVA?
The first step is stating your hypotheses—null (H0H0) assumes no difference among group means; alternative (HaHa) assumes at least one group mean differs significantly.
How do I Calculate the F-statistic in One-Way ANOVA?
The F-statistic is calculated as:
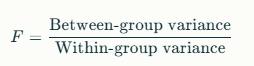
This compares variability due to group differences against random variability within groups.
What are the Key Assumptions of Two-Way ANOVA?
Key assumptions include independence of observations, normal distribution of dependent variables within groups, homogeneity of variances across groups, and balanced sample sizes for accuracy.
Authors
-

Written by:
Neha SinghReviewed by: