Summary: This article provides deep-down insights about the importance of sample size in statistical analyses, highlighting its impact on tests such as t-tests, ANOVA, regression, and Chi-Square tests. It also discusses challenges associated with large samples, including costs, diminishing returns, data management complexities, and risks of sampling bias that researchers must navigate.
Introduction
In statistics, it’s important to know what symbols and notation are used to get the correct data. In statistical analysis, the letter ‘n’ stands for sample size.
Sample size plays an important role in determining how reliable and valid statistical results are. This blog provides information about what ‘n’ means in statistics, why it’s important, how it influences different statistical approaches, and how to calculate it correctly.
What does ‘n’ mean in Statistics?
The letter ‘n’ is universally recognized as a symbol for sample size in statistics. Specifically, it denotes the number of observations or data points collected from a population for analysis. For instance, if a researcher conducts a survey involving 150 participants, the sample size ‘n’ would be 150.
Key Takeaways
- Sample size influences the precision and reliability of statistical analyses significantly.
- Larger samples enhance power in detecting true effects and differences.
- Cost and resource constraints can limit optimal sample size selection.
- Diminishing returns occur beyond a certain sample size threshold.
- Sampling bias can undermine results even with large sample sizes.
What is the Importance of Sample Size
The sample size plays an important role in multiple activities. A larger sample size generally leads to more accurate estimates of population parameters and enhances the power of statistical tests. Here are some key reasons why sample size matters a lot:
- Precision: A larger ‘n’ reduces the margin of error in estimates, leading to more reliable results.
- Statistical Power: Increased sample sizes enhance the ability to detect true effects or differences when they exist, reducing the likelihood of Type II errors (failing to reject a false null hypothesis).
- Generalizability: A well-chosen sample size allows findings to be generalized to the broader population with greater confidence.
- Variability Capture: Larger samples are better at capturing the natural variability within a population, leading to more robust conclusions.
- Confidence Intervals: The width of confidence intervals decreases as sample size increases, providing more precise estimates of population parameters.
Calculating Sample Size
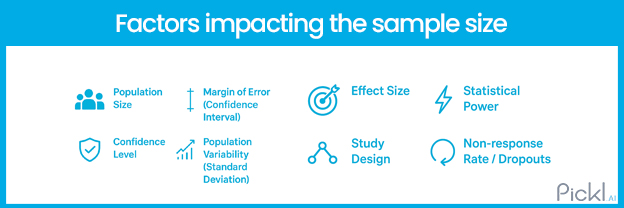
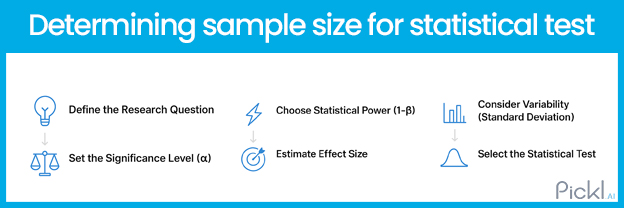
Calculating an appropriate sample size involves several factors, including the desired level of confidence, margin of error, and population variability. The formula for determining sample size can vary depending on the type of study being conducted (e.g., surveys, experiments). A commonly used formula for estimating sample size for proportions is:
n=Z2⋅p(1−p)E2n=E2Z2⋅p(1−p)
Where:
- nn = required sample size
- ZZ = Z-score (the number of standard deviations from the mean)
- pp = estimated proportion of an attribute present in the population
- EE = margin of error
For example, if a researcher wants a 95% confidence level (Z-score ≈ 1.96), expects that 50% (p = 0.5) of respondents will answer positively, and desires a margin of error of 5% (E = 0.05), they would calculate:
n=(1.96)²⋅n=(0.05)²(1.96)²⋅0.5(1−0.5)=384.16
Thus, rounding up suggests that at least 385 respondents are needed for the survey.
The Role of ‘N’ vs ‘n’
In addition to ‘n,’ you may encounter ‘N’ in statistical literature. While ‘n’ refers to the sample size, ‘N’ typically denotes the total population size from which samples are drawn. Understanding this distinction is essential for interpreting statistical results accurately.
Example Scenario
Consider a study on student performance across several schools in a district where:
- N (total population) = 10,000 students
- n (sample size) = 400 students surveyed
In this case, researchers analyze data from 400 students (n) to make inferences about all 10,000 students (N). This relationship underscores how important it is to choose an appropriate sample size relative to the overall population.
Impact on Statistical Tests
The impact of sample size on statistical tests is intense, influencing precision, power, and reliability. Large samples enhance the accuracy of estimates, improve the ability to detect differences, and ensure valid results across various analyses, including t-tests, ANOVA, regression, and Chi-Square tests.
T-tests
T-tests that make comparisons of two groups, the sample size ‘n’ plays a crucial role in determining the reliability of results. Larger samples yield more accurate estimates of the population mean, minimizing variability in test statistics. This increased precision enhances the likelihood of detecting true differences between groups, leading to more robust conclusions.
ANOVA
In Analysis of Variance (ANOVA), larger sample sizes significantly improve the ability to detect differences between group means. With increased observations, the statistical power of the test rises, allowing researchers to identify even subtle variations among groups. This effectiveness is vital for drawing meaningful insights from complex datasets and informing decision-making processes.
Regression Analysis
In regression analysis, having a sufficient number of observations is essential for accurately estimating relationships between variables. Larger sample sizes enhance the reliability of regression coefficients and increase the model’s predictive power. This ensures that conclusions drawn from the analysis are valid, enabling researchers to make informed predictions and decisions based on data.
Chi-Square Tests
For categorical data analysis using Chi-Square tests, larger sample sizes are critical for ensuring that expected frequencies meet the minimum requirements for valid results. Adequate sample sizes help issues related to small expected counts, which can lead to unreliable conclusions. Thus, larger samples enhance the robustness and credibility of findings in categorical analyses.
Challenges with Sample Size
While larger samples generally yield better results in statistical analyses, there are several challenges associated with increasing sample sizes that researchers must consider. These challenges can impact the feasibility, efficiency, and validity of a study. Below are some of the primary challenges associated with sample size:
Cost
Increasing sample sizes often leads to higher costs, surrounding financial, temporal, and human resources. Researchers must allocate more funds for participant recruitment, data collection tools, and compensation. Additionally, larger samples require more time for data gathering and analysis, potentially requiring additional staff or extended project timelines, which can strain budgets.
Diminishing Returns
As sample sizes grow, the benefits in terms of precision and statistical power may diminish after a certain threshold. Initially, larger samples significantly enhance the accuracy and detectability of effects. However, beyond a specific point, further increases yield only marginal improvements, making additional investments less justifiable for researchers seeking meaningful gains.
Data Management
Managing extensive datasets introduces complexities in data collection and analysis. Larger samples necessitate sophisticated tracking systems to maintain participant information and ensure data integrity. Additionally, researchers face challenges in data cleaning, processing inconsistencies, and employing advanced statistical techniques, all of which can be time-consuming and resource-intensive.
Sampling Bias
Even with large sample sizes, risks of sampling bias persist if participants are not randomly selected. Non-random sampling methods can lead to overrepresentation or underrepresentation of certain groups, skewing results. This bias undermines the generalizability of findings and may result in misleading conclusions that do not accurately reflect the target population.
Conclusion
Understanding what ‘n’ means in statistics is fundamental for anyone involved in data analysis or research design. The sample size directly impacts the reliability and validity of findings while influencing various statistical methods and tests used in research.
By carefully considering how many observations to include in their studies, researchers can enhance their ability to draw meaningful conclusions from their data.
Frequently Asked Questions
What does ‘n’ represent in statistics?
In statistics, ‘n’ represents the sample size or number of observations collected from a population for analysis. It is crucial for determining the reliability and accuracy of statistical estimates.
How does sample size affect statistical power?
A larger sample size increases statistical power by enhancing the ability to detect true effects or differences within data while reducing Type II errors during hypothesis testing.
What is the difference between ‘n’ and ‘N’?
In statistics, ‘n’ refers to the sample size drawn from a population, while ‘N’ denotes the total population size from which samples are taken for analysis or inference purposes.
What does “n” mean in math statistics?
In statistics, the lowercase letter “n” signifies the sample size, which is the total number of observations or data points in a particular sample.
Authors
-

Written by:
Karan ThaparReviewed by: