
Summary: This comprehensive guide delves into memory leaks and profiling in Python, covering their definitions, identification methods, and resolution techniques. It also discusses advanced topics like Python’s garbage collector, memory optimization strategies, and profiling tools. Real-world examples illustrate these concepts, helping developers ensure efficient memory management in their applications.
Introduction
In the world of software development, memory management is a critical aspect that can make or break an application’s performance. Python, being a high-level programming language, abstracts away many low-level memory management details, making it easier for developers to write code.
However, this abstraction can sometimes lead to unexpected memory usage patterns, known as memory leaks. In this blog post, we’ll dive deep into the world of memory leaks in Python, exploring how to identify, profile, and resolve them, as well as discuss advanced topics related to memory management in Python.
Understanding Memory Leaks in Python

A memory leak occurs when an application allocates memory but fails to release it when it’s no longer needed. In Python, this can happen when objects that are no longer being used are not correctly deallocated by the garbage collector.
Over time, as the application continues to allocate memory without freeing it, the amount of memory used by the application grows, potentially leading to degraded performance and even crashes.Memory leaks in Python can be caused by a variety of factors, such as:
- Circular references: When two or more objects reference each other, creating a cycle that the garbage collector cannot break.
- Unclosed files or network connections: If a file or network connection is opened but not closed, it can lead to a memory leak.
- Caching or memoisation: While caching can improve performance, if the cache is not properly managed, it can lead to memory leaks.
- Unintended object retention: If an object is referenced by another object, but the reference is never removed, the garbage collector cannot deallocate the unused object.
Read More:
Introduction to Model Validation in Python
Identifying Memory Leaks

Identifying memory leaks in Python can be challenging, as they may not be immediately apparent. However, there are several techniques and tools that can help you identify and diagnose memory leaks in your application.
One of the most effective ways to identify memory leaks is to monitor your application’s memory usage over time. You can use tools like the tracemalloc module, which is a built-in Python module that can be used to track the allocation of memory blocks in Python.
Here’s an example of how to use tracemalloc to take a snapshot of the current memory allocation and print the statistics:
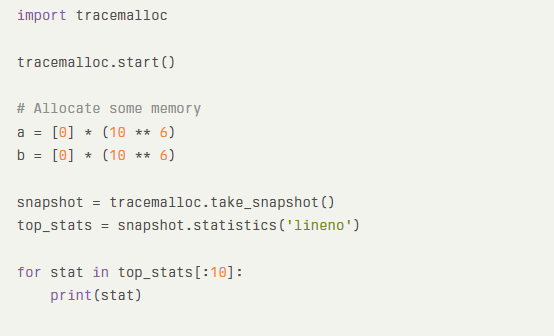
This code will output the top 10 memory blocks that are currently allocated, sorted by the size of the memory blocks. You can use this information to identify the source code locations where the largest memory blocks are being allocated, which may be indicative of a memory leak.
Another useful tool for identifying memory leaks is the objgraph library, which can be used to visualise the object reference graph of your Python application. This can help you identify circular references and other object retention issues that may be causing memory leaks.
Profiling Memory Usage
In addition to identifying memory leaks, it’s also important to profile your application’s memory usage to identify areas where memory optimization can be performed. Python provides several tools for profiling memory usage, such as the memory_profiler library, which can be used to track the memory usage of a function or script over time.
Here’s an example of how to use memory_profiler to profile a function:
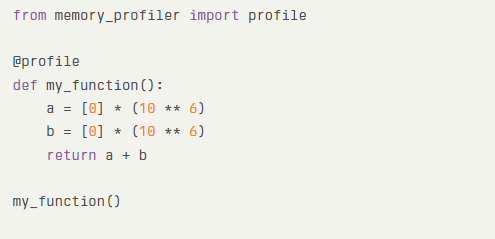
This code will output the memory usage of the my_function function at each line of code, allowing you to identify which parts of your code are using the most memory.
Another useful tool for profiling memory usage is the pympler library, which provides a set of tools for measuring, monitoring, and analysing the memory behaviour of Python objects.
Resolving Memory Leaks
Once you’ve identified a memory leak in your Python application, the next step is to resolve it. There are several techniques that can be used to resolve memory leaks, depending on the cause of the leak.
One common technique for resolving memory leaks is to ensure that all references to unused objects are removed when they are no longer needed. This can be done by setting the reference to None or by deleting the reference altogether. Here’s an example:
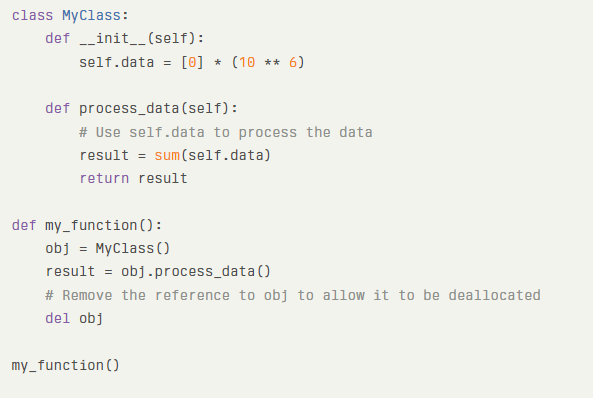
In this example, the MyClass object is no longer needed after the process_data method is called. By setting the reference to obj to None or deleting it altogether, we allow the object to be deallocated by the garbage collector, preventing a memory leak.
Another technique for resolving memory leaks is to use context managers or the with statement to ensure that resources like files or network connections are properly closed when they are no longer needed. Here’s an example:
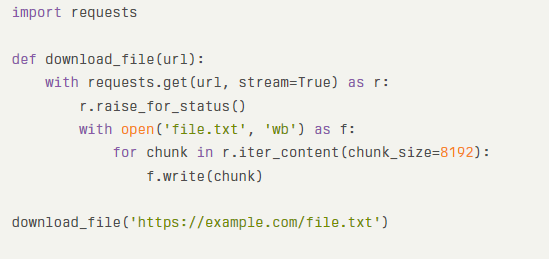
In this example, the requests library is used to download a file from a URL. The with statement is used to ensure that the HTTP connection is properly closed when the file has been downloaded, preventing a memory leak.
Advanced Topics
In this section, we’ll explore advanced topics related to memory management in Python, including the inner workings of the garbage collector, memory optimisation techniques, and profiling tools suitable for production environments.
Understanding Python’s Garbage Collector
Python’s garbage collector is responsible for automatically deallocating memory that is no longer being used by the application. While the garbage collector is generally effective at managing memory, it has some limitations that can lead to memory leaks.
One key limitation of Python’s garbage collector is that it cannot break circular references. If two or more objects reference each other, creating a cycle, the garbage collector cannot determine that the objects are no longer being used and will not deallocate them.
To resolve this type of memory leak, you need to manually break the circular reference by removing the reference from one of the objects.
Memory Optimisation Techniques
In addition to resolving memory leaks, it’s also important to optimise your application’s memory usage to ensure that it runs efficiently. There are several techniques that can be used to optimise memory usage in Python, such as:
- Using generators instead of lists: Generators can be more memory-efficient than lists, especially when working with large datasets.
- Using the __slots__ attribute: The __slots__ attribute can be used to limit the attributes that can be added to an object, reducing memory usage.
- Using the weakref module: The weakref module can be used to create weak references to objects, allowing the garbage collector to deallocate the objects even if they are still referenced.
Profiling Tools in Production
While the tools mentioned earlier are useful for identifying and diagnosing memory leaks during development, they may not be suitable for use in production environments. In production, you need to use tools that have minimal impact on the performance of your application.
One tool that can be used for profiling memory usage in production is the pympler library, which provides a set of tools for measuring, monitoring, and analysing the memory behaviour of Python objects. Another tool is the memory_profiler library, which can be used to track the memory usage of a function or script over time.
Case Studies and Examples
To illustrate the concepts discussed in this blog post, let’s look at a few examples of memory leaks in Python and how to resolve them.
Example 1: Circular References
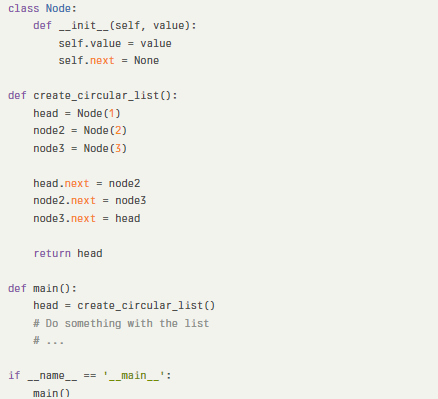
In this example, we create a circular linked list using the Node class. The create_circular_list function creates three Node objects and sets up a circular reference between them. The main function calls create_circular_list to create the circular list, but doesn’t do anything with it.
When the main function returns, the head object is no longer referenced by any other object. However, because of the circular reference between the Node objects, the garbage collector cannot deallocate them, leading to a memory leak.
To resolve this memory leak, we need to manually break the circular reference by setting the next attribute of the last Node object to None:
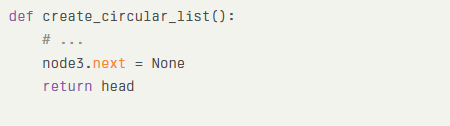
By setting node3.next to None, we break the circular reference and allow the garbage collector to deallocate the Node objects when they are no longer being used.
Example 2: Unclosed Files
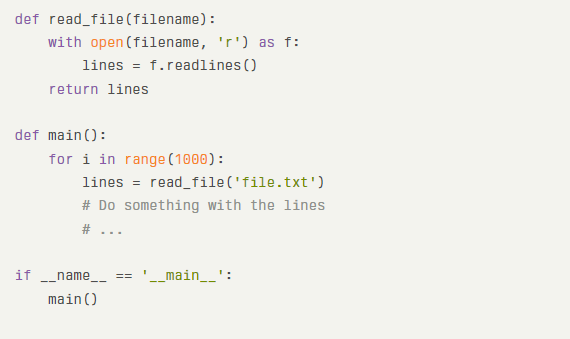
In this example, the read_file function opens a file, reads its contents into a list of lines, and returns the list. The main function calls read_file 1000 times to read the contents of the file repeatedly.
While the with statement is used to ensure that the file is properly closed when the read_file function returns, if an exception occurs inside the with block, the file may not be closed properly, leading to a memory leak.
To resolve this memory leak, we need to ensure that the file is properly closed even if an exception occurs. We can do this by using a try-finally block:
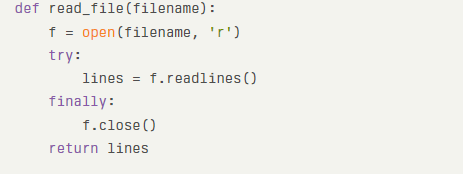
By using a try-finally block, we ensure that the close method is called on the file object, even if an exception occurs inside the try block. This prevents the file from being left open, which could lead to a memory leak.
Conclusion
Memory leaks can be a challenging problem to diagnose and resolve in Python applications. However, by understanding how memory leaks occur, using tools like tracemalloc and objgraph to identify them, and applying techniques like breaking circular references and closing resources properly, you can effectively manage memory usage in your Python applications.
Remember, preventing memory leaks is an ongoing process that requires vigilance and attention to detail. By incorporating memory management best practices into your development workflow, you can ensure that your Python applications run efficiently and reliably, even under high load.
Frequently Asked Questions
What is the Difference Between a Memory Leak and a Memory Fragmentation?
Memory leaks occur when memory is allocated but never freed, leading to a gradual increase in memory usage over time. Memory fragmentation, on the other hand, occurs when memory is allocated and freed in a way that creates gaps or fragments in the memory space, making it difficult to allocate large contiguous blocks of memory.
Can Memory Leaks in Python be Completely Eliminated?
While memory leaks in Python can be minimised through careful coding practices and the use of tools like tracemalloc and objgraph, they cannot be completely eliminated. Python’s garbage collector, while generally effective, has some limitations that can lead to memory leaks in certain situations.
Are Memory Leaks in Python a Common Problem?
Memory leaks in Python are not as common as in lower-level languages like C or C++, where manual memory management is required. However, they can still occur in Python applications, especially in long-running processes or applications that handle large amounts of data.
Authors
-

Written by:
Aashi VermaReviewed by: