Summary: This blog explores the importance of inferential statistics in advancing your career in Data Science. It covers key concepts, such as hypothesis testing, confidence intervals, and regression analysis, demonstrating how these techniques can improve your analytical skills and decision-making abilities, ultimately making you a more valuable asset in the data-driven landscape.
Introduction
Understanding data is key! Descriptive statistics summarize your data (averages, spreads), while inferential statistics use samples to draw conclusions about larger populations. Descriptive statistics paint a picture of your data, while inferential statistics make predictions based on that picture. Both play a crucial role in Data Analysis across various fields.
The world of Data Science is a treasure trove of information. But how do we move beyond simply describing what’s in that trove and use it to make predictions or draw conclusions about the bigger picture?
This is where inferential statistics come in – the powerful tools that empower you to make informed decisions based on data, propelling your Data Science career forward.
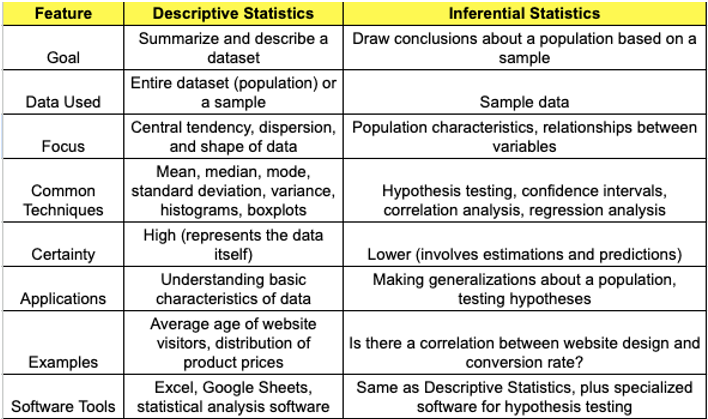
Descriptive vs. Inferential Statistics: Understanding the Difference

Before diving into the world of inference, let’s establish a clear distinction between descriptive and inferential statistics. Descriptive statistics, as the name suggests, describe the characteristics of a dataset.
They provide a snapshot of the data, summarizing it through measures like mean, median, standard deviation, and frequency distributions. These metrics help us understand the central tendency, spread, and shape of the data.
Inferential statistics, on the other hand, go a step further. They use information from a sample (a subset of the population) to draw conclusions about the entire population. This allows us to make generalizations, test hypotheses, and ultimately gain insights beyond the confines of the sample data.
Here’s an analogy: Imagine you want to understand the average height of people in your city. Measuring everyone would be impractical. So, you take a random sample of 100 people and calculate their average height.
Inferential statistics then allow you to estimate the average height of the entire population (all the city’s residents) with a certain level of confidence, based on the sample data.
Key Concepts in Inferential Statistics: Tools for Making Inferences
Inferential statistics offer a robust toolkit for drawing conclusions about populations. Let’s explore some key concepts:
Hypothesis Testing
This is the process of formulating a claim (hypothesis) about a population parameter (e.g., average income) and statistically testing its validity based on sample data. We define two types of hypotheses:
Null Hypothesis (H0): This is the default assumption, often stating “no difference” or “no effect.”
Alternative Hypothesis (H1): This is the opposite of the null hypothesis, stating that there is a difference or effect.
Through statistical tests (e.g., t-tests, chi-square tests), we calculate a p-value, which represents the probability of observing the data we did, assuming the null hypothesis is true. A low p-value (typically less than 0.05) suggests we should reject the null hypothesis and support the alternative hypothesis.
Confidence Intervals
While hypothesis testing provides a binary result (reject or fail to reject), confidence intervals estimate the range of values within which a population parameter is likely to fall, with a certain level of confidence (e.g., 95%). This allows us to quantify the uncertainty associated with our inferences.
Sample Size
The size of your sample significantly impacts the reliability of your inferences. Larger samples generally lead to more accurate estimates and narrower confidence intervals.
Statistical Significance vs. Practical Significance
A statistically significant result (low p-value) doesn’t always translate to a real-world impact. We need to consider the practical significance of our findings – does a small difference observed in the sample actually matter in the real world?
Examples of Inferential Statistics in Action: Bringing Theory to Practice
Imagine you work for an e-commerce company. You want to know if offering free shipping increases customer purchase amounts. Here’s how inferential statistics can help:
Hypothesis Testing
H0: Free shipping does not affect the average purchase amount.
H1: Free shipping increases average purchase amount.
You randomly select a group of customers and offer them free shipping, while another group pays for shipping. You then compare the average purchase amount between the two groups.
Based on the p-value obtained from a statistical test (e.g., t-test), you decide whether to reject the null hypothesis (free shipping has no effect) or fail to reject it.
If the p-value is low (e.g., 0.02), you can conclude with some confidence that free shipping does indeed increase average purchase amount, potentially leading to a strategic decision to offer free shipping more often.
Another Example: A social media platform wants to know if a new ad campaign is effective in increasing user engagement. They can use inferential statistics to compare user engagement metrics (likes, shares, comments) before and after the campaign launch, statistically testing if the campaign led to a significant increase in engagement.
These are just a few examples, but inferential statistics can be applied to a wide range of scenarios in Data Science, from healthcare research to marketing campaigns.
Mastering Inferential Statistics: Empowering Your Data Science Journey
Understanding and applying inferential statistics offers a multitude of benefits for Data Scientists, making them more valuable assets in any organization. Here’s how:
Data-Driven Decision Making
Inferential statistics equip you with the tools to move beyond hunches and intuition. You can translate data into actionable insights that inform strategic decisions across various business domains.
Increased Credibility
By incorporating hypothesis testing and confidence intervals into your analyses, you add a layer of rigor and scientific backing to your findings. This enhances your credibility and persuasiveness when presenting results to stakeholders.
Improved Experimental Design
Understanding the impact of sample size and statistical power allows you to design experiments that are more likely to yield reliable and generalizable results.
Advanced Data Analysis Techniques
Mastering inferential statistics opens doors to more sophisticated Data Analysis techniques like regression analysis, which helps you model relationships between variables and make predictions.
Developing Your Inferential Statistics Expertise: Resources and Tips
In this section, we provide actionable tips and resources to help you develop your expertise in inferential statistics. From online courses and tutorials to practical projects and networking opportunities, these strategies will empower you to deepen your understanding and apply inferential statistics effectively in your data science work:
Online Courses and Tutorials
Numerous online platforms offer courses and tutorials on inferential statistics, catering to all learning styles, from beginner-friendly to advanced.
Books and Textbooks
Several books delve deep into inferential statistics, providing a comprehensive theoretical foundation and practical examples.
You can read: https://pickl.ai/blog/10-best-statistics-books-for-data-science/
Practice with Real-World Datasets
The best way to solidify your understanding is by applying inferential statistics to real-world datasets. Kaggle and other Data Science platforms offer a wealth of datasets for you to experiment with.
Statistical Software
Familiarize yourself with statistical software packages like R, Python’s SciPy library, or SAS. These tools allow you to perform complex statistical analyses efficiently.
Inferential Statistics – The Stepping Stone to Data Science Success
As you progress in your Data Science career, inferential statistics will become an indispensable tool. Don’t be intimidated by the initial learning curve. By investing time and effort in mastering these powerful techniques, you’ll unlock the ability to make informed decisions based on data.
Remember, inferential statistics are not just about numbers – they are about extracting knowledge and insights that have the power to transform the world around us.
Frequently Asked Questions
What is The Difference Between Descriptive and Inferential Statistics?
Descriptive statistics describe the data you have (means, medians), while inferential statistics use samples to make predictions about a larger population (testing hypotheses, confidence intervals).
When Should I Use Descriptive Statistics?
Descriptive statistics are great for getting a basic understanding of your data – what’s the average, how spread out is it?
When Should I Use Inferential Statistics?
Use inferential statistics when you want to draw conclusions about a larger group (population) based on a smaller sample. This is helpful for testing hypotheses and making predictions.
Authors
-

Written by:
Neha SinghReviewed by: