
Summary: Market Basket Analysis in Python uncovers purchasing patterns using the Apriori algorithm. Businesses use it to optimise product placement, marketing, and inventory. By analysing transaction data, they improve cross-selling and customer experience. Python’s powerful libraries make implementation efficient, helping retailers and e-commerce platforms drive sales and profitability.
Introduction
We live in a world driven by data, where businesses use analytics to understand customer behaviour and boost sales. Market Basket Analysis in Python helps companies find patterns in customer purchases, improving cross-selling, product placement, and marketing strategies.
Per the PYPL Index, Python is the leading programming language with a 17.7% global market share in 2022, making analysis easy and effective. This blog will explain how Market Basket Analysis works, its benefits, and how to apply it in Python.
Whether you’re a business owner or a beginner in data science, you’ll learn how to uncover hidden insights to improve sales and customer experience.
Market Basket Analysis involves working on large data sets. It includes the buying history, revealing product groupings and products purchased together. Hence, this tool becomes quite significant for retailers. This article will explore how to perform Market Basket Analysis in Python.
Key Takeaways
- Market Basket Analysis in Python identifies frequently bought-together items to improve business strategies.
- The Apriori algorithm finds strong product associations using support, confidence, and lift metrics.
- Retailers benefit by optimising product placement, inventory, and cross-selling opportunities.
- Python’s libraries, like mlxtend, simplify the implementation of Market Basket Analysis.
- Despite challenges, businesses can use it to boost sales, personalise recommendations, and enhance marketing.
What is Market Basket Analysis in Python?
Market Basket Analysis, Association Analysis or Affinity Analysis is a data mining technique that unfurls product relationships based on consumer purchase patterns.
Python provides various libraries and tools to perform Market Basket Analysis efficiently.
One such commonly used library is the mlxtend library. It offers a range of functionalities for performing association rule mining, including the Apriori algorithm (discussed later), a popular algorithm for Market Basket Analysis.
By analysing customer transaction data, MBA or Market Basket Analysis allows businesses to uncover patterns, associations, and dependencies that are not immediately apparent.
This knowledge can be leveraged to optimise business strategies, improve customer experience, and drive revenue growth. The next segment of this blog discusses some of the critical aspects of MBA and provides examples.
How Do You Do Market Basket Analysis in Python?
As we have mentioned, several Python libraries are used for MBA. Apriori Algorithm is one of the most commonly used Python libraries for association data mining.
What is Association Rule Mining?
Apriori Algorithm is used for association rule mining, which unfolds the pattern of items purchased together and concurrence in the same. For example, one can find a correlation and association between different items that customers purchase and the recurring pattern.
Let’s say Raghav buys a bottle of cold drinks and adds chips and wafers to his basket. The store manager analyses that many other customers, like Raghav, purchase cold drinks, chips, and wafers. So, the manager starts placing these products together, eventually boosting sales.
This process of analysing the association between different purchased products is called association rule mining. The Apriori algorithm, one of the most popular and efficient algorithms, implements association rule mining.
How Does the Apriori Algorithm Work?
The Apriori algorithm is popular in Market Basket Analysis and association rule mining. Its primary purpose is to identify frequent itemsets within a transactional dataset. Here’s an explanation of how the Apriori algorithm works:
Support
The algorithm begins by scanning the dataset to calculate each item’s support. Support refers to an item’s frequency in the dataset and is expressed as a percentage or decimal value.
Generating Candidate Itemsets
The algorithm generates candidate item sets based on the support values. Initially, it creates a list of frequent 1-item sets, individual items that meet the minimum support threshold. These frequent 1-itemsets are considered as the seeds for generating larger itemsets.
Joining Step
In this step, the algorithm joins the frequent (k-1)-itemsets to generate candidate k-itemsets. It combines itemsets that share the first (k-2) items. For example, if we have frequent 2-itemsets {A, B} and {A, C}, the algorithm joins them to create a candidate 3-itemset {A, B, C}.
Pruning Step
The pruning step eliminates candidate itemsets that contain infrequent subsets. If any (k-1)-subset of a candidate k-itemset is infrequent, the candidate k-itemset is pruned since it cannot be a frequent itemset.
Scanning the Dataset
After generating candidate item sets, the algorithm scans the dataset again to calculate each item set’s support.
Repeat
Steps 3 to 5 are repeated iteratively until no more frequent itemsets can be generated. The algorithm continues until it reaches this stage.
Association Rule Generation
Once all frequent item sets are discovered, association rules are generated. These rules consist of an antecedent (left-hand side) and a consequent (right-hand side). The antecedent represents the items that imply the presence of the resultant in a transaction.
Rule Evaluation
Finally, the generated association rules are evaluated based on support, confidence, and lift metrics. Support measures the frequency of the rule, confidence indicates the likelihood of the consequent item being purchased given the antecedent, and lift measures the strength of the association between the antecedent and the resultant.
Steps of Market Basket Analysis in Python
Understanding the steps of Market Basket Analysis in Python is essential for uncovering hidden patterns in sales data. Analysing purchase behaviour helps businesses optimise product placement, improve marketing strategies, and enhance customer experience. This knowledge enables data-driven decision-making, boosting profitability and operational efficiency. The steps of Market Basket Analysis in Python are as follows:
Preparing the Dataset
It is crucial to gather and prepare the dataset for Market Basket Analysis before implementing it. The dataset should consist of transactional records, each representing a unique customer purchase and containing a list of items purchased.
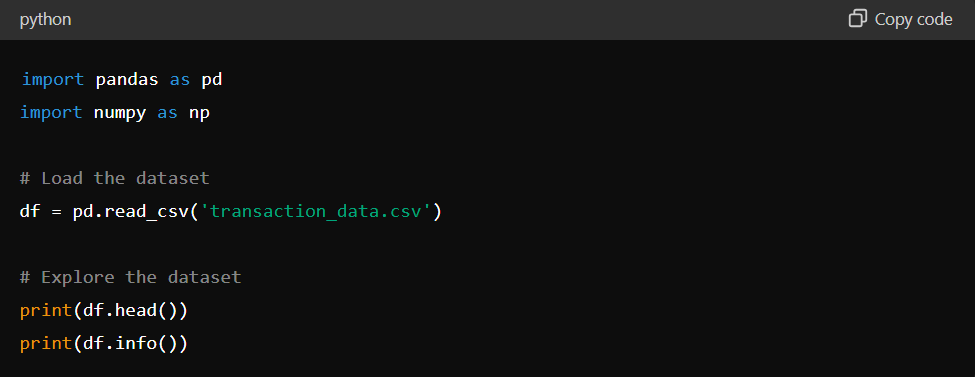
First, we must import Python libraries, such as Pandas and NumPy, for data manipulation and analysis. We can then load the dataset into a Pandas DataFrame and explore its structure using various functions and methods provided by the library.
Data Preprocessing and Exploration
Once the dataset is loaded, it is essential to preprocess and explore the data to ensure its quality and understand its characteristics. This step involves handling missing values, removing duplicates, and transforming the data into the appropriate format for analysis.
Handling Missing Values
Missing values can hinder the accuracy and reliability of the analysis. Therefore, it is crucial to handle them appropriately. Depending on the dataset, you can remove rows or fill in missing values with appropriate techniques, such as mean imputation or forward/backward filling.
Removing Duplicates
Duplicate records can skew the analysis results, leading to inaccurate associations. Removing duplicates ensures that each transaction is considered only once during the analysis, providing more reliable insights.
Data Transformation
Most MBA algorithms require the data to be in a binary format, where each column represents a unique item, and the values indicate whether an item is present in a particular transaction. We can use one-hot or binary encoding techniques to transform the dataset into this format.
Applying Apriori Algorithm
The Apriori algorithm is a popular and widely used algorithm for Market Basket Analysis. It helps identify frequent itemsets and generate association rules based on them. The algorithm follows the “Apriori property” principle, which states that any subset of a frequent itemset must also be frequent.
To implement the Apriori algorithm in Python, we can utilise the mlxtend library, which efficiently implements various association rule mining algorithms.
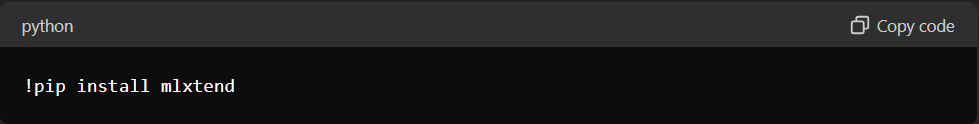
Installing mlxtend
Before proceeding, we need to install the mlxtend library using pip:
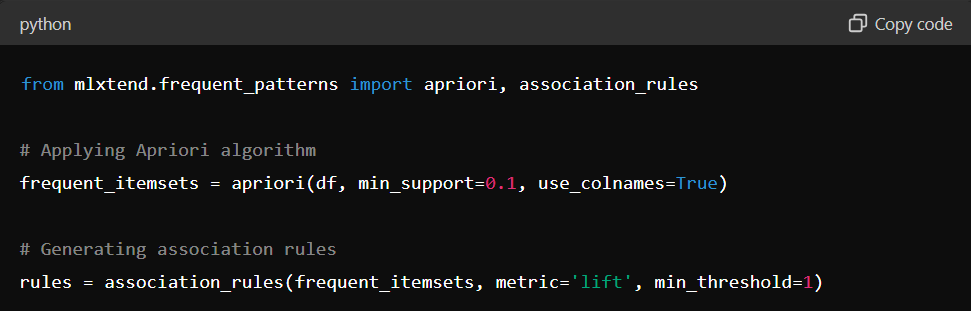
Applying Apriori
Once the library is installed, we can import the necessary functions and apply the Apriori algorithm to our preprocessed dataset.
Analysing the Results
After applying the Apriori algorithm, we obtain a set of frequent item sets and corresponding association rules. Businesses can use these rules to gain valuable insights into product relationships and optimise their strategies.
Interpreting Association Rules
Association rules consist of an antecedent (left-hand side), a consequent (right-hand side), and various metrics such as support, confidence, and lift. Here’s an example of you can interpret an association rule in the following way:
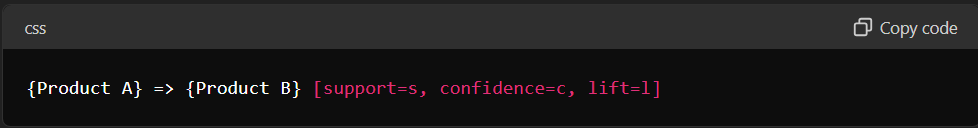
- Support: Indicates the frequency of occurrence of both products in transactions.
- Confidence: This represents the conditional probability of purchasing Product B given that Product A has already been purchased.
- Lift: Measures the strength of the association between the antecedent and the consequent. A lift greater than 1 indicates a positive association.
Filtering and Sorting Rules
Depending on your business goals, you can filter the generated association rules based on specific metrics. For example, you may focus on rules with high support and confidence values to identify strong associations. Additionally, sorting the rules based on the lift can reveal the most influential associations.
Visualising the Results
Data visualisation plays a crucial role in conveying insights effectively. By visualising the association rules, we can better understand the relationships between products and identify patterns that might not be immediately apparent in tabular form.
Python offers various libraries for data visualisation, such as Matplotlib and Seaborn. These libraries enable us to create bar plots, scatter plots, and network graphs to visualise the association rules and their corresponding metrics.
This structured approach outlines the necessary steps and considerations for conducting Market Basket Analysis using Python, from data preparation to visualisation of results.
Step-by-Step Example of Market Basket Analysis
To understand the steps mentioned above, let’s consider an example:
ABC retail store sells groceries. It collects transactional data, including information about customer purchases. Each transaction has a unique identifier (e.g., receipt number) and a list of items bought together.
With Market Basket Analysis, the store aims to understand the association and pattern between different customer products. Based on this data, it will optimise its business strategy.
Step 1: Data Collection
The store gathers transactional data over some time. For example, they have a dataset containing information about individual transactions, such as:
1 Transaction: Milk, Bread, Eggs, Cheese
2 Transaction: Bread, Butter, Eggs
3 Transaction: Milk, Bread, Butter, Yogurt
4 Transaction: Bread, Eggs, Cheese, Yogurt
Step 2: Data Preprocessing
Cleansing of data to ensure precise outcomes. Removal of duplicity or irrelevant information.
Step 3: Transaction Encoding:
The system encodes the transaction data into a suitable format for analysis. One common approach uses binary encoding, representing each item as a binary variable (0 or 1) to indicate its presence or absence in a transaction.
1 Transaction: 1, 1, 1, 1
2 Transaction: 1, 0, 1, 0
3 Transaction: 1, 1, 0, 1
4 Transaction: 1, 0, 1, 1
Step 4: Frequent Itemset Mining
The store identifies frequent item sets using the Apriori algorithm based on a specified support threshold. For this example, let’s assume a support threshold of 50%.
Frequent 1-itemsets:
Bread: 4
Eggs: 3
Milk: 2
Butter: 2
Cheese: 2
Yoghurt: 2
Step 5: Association Rule Generation
From the frequent itemsets, the store generates association rules. These rules consist of an antecedent (left-hand side) and a consequent (right-hand side). For example:
If customers buy Bread and Eggs, they will also buy Milk. (Bread, Eggs) -> (Milk)
If customers buy Butter and Yogurt, they are likely to buy Bread. (Butter, Yogurt) -> (Bread)
Step 6: Rule Evaluation
We evaluate the generated rules based on support, confidence, and lift metrics, which provide insights into the strength and significance of the associations.
For example, the rule (Bread, Eggs) -> (Milk) may have a support of 25%, confidence of 66% (indicating that 66% of transactions containing Bread and Eggs also contain Milk), and a lift value greater than 1, indicating a positive association.
Step 7: Interpretation and Action
The store analyses the generated rules to gain insights and take appropriate action. For example, it may strategically place Milk near the Bread and Eggs sections to encourage additional purchases. It might also create promotions or discounts targeting customers who purchase Butter and Yogurt together to increase Bread sales.
The retail store can optimise product placement by utilising market basket analysis, create targeted marketing campaigns, and enhance customer satisfaction, increasing sales and profitability.
Benefits of Market Basket Analysis
Market Basket Analysis is a powerful technique that helps businesses optimise marketing strategies and operational efficiency by identifying product associations and customer purchasing patterns. Here are the key benefits:
- Identifying Product Associations: Helps businesses uncover frequently purchased product combinations to optimise placement and cross-selling strategies.
- Personalised Recommendations: Enables tailored product suggestions based on purchase history, improving customer experience and sales.
- Optimising Inventory Management: Ensures adequate stock levels for frequently co-purchased items, reducing stockouts and holding costs.
- Effective Pricing Strategies: Identifies bundling opportunities, allowing businesses to create attractive pricing incentives.
- Targeted Marketing Campaigns: Enhances promotions by offering personalised discounts based on common purchasing behaviours.
- Improving Store Layout: Helps retailers place related items together to increase convenience and impulse purchases.
- Data-Driven Decision Making: Provides insights based on actual purchase data, improving strategic accuracy.
By leveraging Market Basket Analysis, businesses can enhance customer satisfaction, drive sales, and optimise operations efficiently.
Limitations of Market Basket Analysis
While Market Basket Analysis offers valuable insights, it also has certain limitations that businesses should consider when implementing this technique. Here are some key challenges:
- Data Quality Issues: The accuracy of results depends on clean, well-structured data. Incomplete or inconsistent data can lead to misleading associations.
- Lack of Context: It identifies product correlations but does not explain why customers buy items together, limiting deeper behavioural insights.
- Static Analysis: Traditional Market Basket Analysis focuses on past transactions and may not adapt to changing customer preferences or seasonal trends.
- High Computational Requirements: Processing large datasets with complex associations can be resource-intensive, requiring advanced computing power.
- Overemphasis on Frequent Items: It highlights commonly purchased items but may overlook less frequent but valuable associations.
- Difficulty in Implementation: Integrating insights into pricing, inventory, or marketing strategies can be challenging without proper execution.
Despite these limitations, businesses can maximise Market Basket Analysis by combining it with other analytical techniques and dynamic data strategies.
Conclusion
Market Basket Analysis in Python is a powerful data mining technique that helps businesses uncover customer purchasing patterns. By leveraging the Apriori algorithm, companies can identify frequently bought-together items, improve product placement, and enhance marketing strategies. This analysis enables data-driven decision-making, leading to increased sales and customer satisfaction.
Despite challenges like data quality and computational complexity, businesses can optimise operations by integrating Market Basket Analysis with other analytics techniques. With Python’s powerful libraries like mlxtend, companies can efficiently apply this approach to improve cross-selling, personalise recommendations, and drive profitability, making it a crucial tool for retail and e-commerce success.
Frequently Asked Questions
What is Market Basket Analysis in Python?
Market Basket Analysis in Python uncovers product relationships from customer purchase patterns using data mining techniques. Libraries like `mlxtend` and algorithms like Apriori help analyse transactional data to improve sales strategies.
How does the Apriori algorithm work for Market Basket Analysis?
The Apriori algorithm identifies frequent item sets in a dataset. It calculates support, generates candidate itemsets, prunes infrequent subsets, and iterates until no more frequent itemsets exist. It then generates and evaluates association rules.
Why is Market Basket Analysis Critical for Retailers?
Market Basket Analysis helps retailers optimise product placement, enhance cross-selling, personalise recommendations, manage inventory, and design targeted marketing campaigns, ultimately boosting sales and customer satisfaction.
Authors
-

Written by:
Versha RawatReviewed by:


