Summary: Data Blending in Tableau combines data from different sources for comprehensive analysis. It is used when data cannot be joined directly and has limitations like performance issues and restricted join types.
Introduction
Imagine you are preparing a delicious dish that requires ingredients from different stores. You pick up spices from one shop and fresh vegetables from another. Once you have all the ingredients, you combine them to create a flavorful meal. Similarly, data blending in Tableau is the process of pulling data from multiple sources and combining it to create meaningful insights, much like blending ingredients to make a perfect dish.
In Tableau, data blending allows analysts to merge disparate datasets dynamically, enabling them to visualize and analyze data from multiple sources in a single view. This feature is particularly useful when data resides in different databases or formats and cannot be directly joined due to differences in structure or granularity.
What is Data Blending in Tableau?
Data Blending in Tableau is a technique for combining data from multiple sources. Unlike traditional data merging or joining, which requires a shared key and happens at the database level, Data Blending occurs at the visualisation level within Tableau.
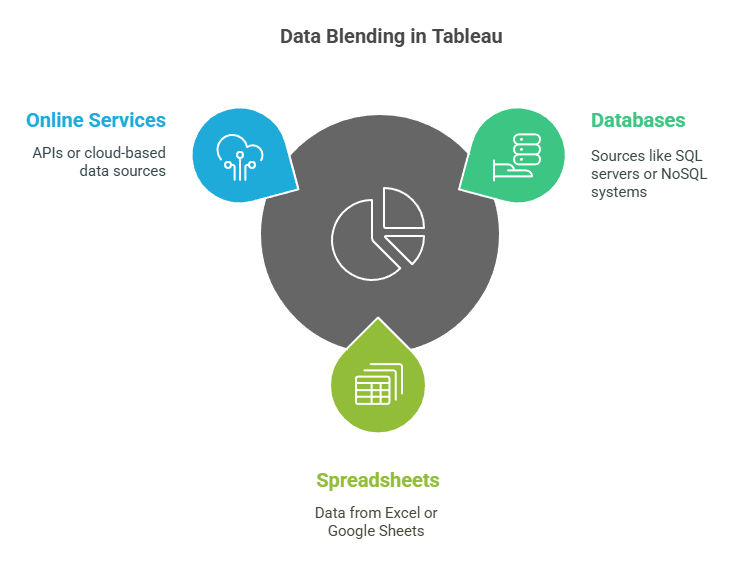
This allows users to integrate data from disparate sources, such as databases, spreadsheets, and online services, without needing to preprocess or combine the data beforehand.
Why is Data Blending Important?
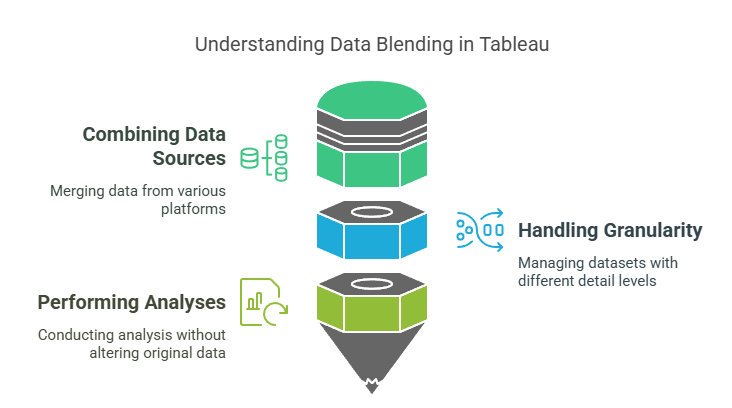
Data blending provides flexibility and efficiency in analytics by allowing users to:
- Combine data from different sources, such as SQL databases, Excel files, or cloud-based platforms.
- Handle datasets with varying levels of granularity.
- Perform analyses without altering the original datasets or creating complex database joins.
For example, consider a business analyst working with sales data stored in Oracle and customer data stored in SQL Server. Using Tableau’s data blending feature, the analyst can merge these datasets seamlessly to generate insights about customer behavior and sales performance
Steps to Perform Data Blending in Tableau
Data blending in Tableau is a powerful method for combining datasets from different sources to create unified and insightful visualizations. Below, we expand on the steps involved in performing data blending, using the example of blending Car Sales Data and Bike Sales Data.
This process will help you understand how to effectively utilize Tableau’s data blending feature while incorporating competitive keywords such as “Tableau data blending tutorial,” “primary and secondary data sources,” and “custom blend relationships.”
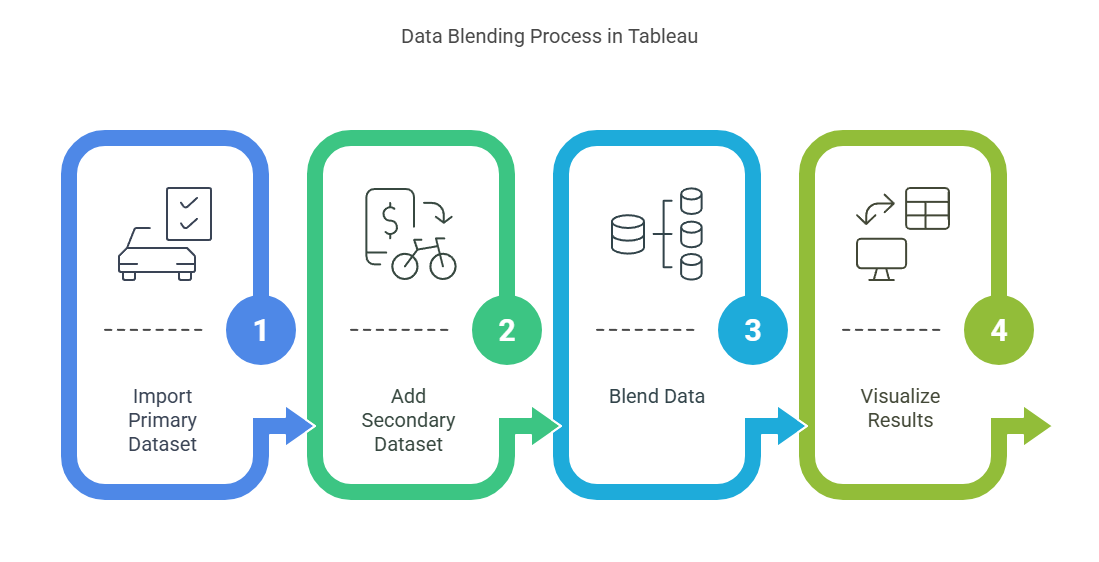
Step 1: Import Primary Dataset
The first step in data blending is importing the primary dataset into Tableau. This dataset serves as the foundation for your visualization.
- Connect to the Primary Dataset: Open Tableau and connect to the Car Sales dataset, which might be stored in an Excel file, SQL database, or another source.
- Drag Relevant Fields: Drag fields such as “Region” or “Sales Volume” onto the worksheet. This establishes the primary data source for your analysis.
Tip: The primary data source is automatically assigned based on the first field added to the worksheet. It is marked with a blue checkmark in Tableau’s Data Pane.
Step 2: Add Secondary Dataset
Next, you need to bring in the secondary dataset, which provides additional information to enhance your analysis.
- Connect to the Secondary Dataset: Add the Bike Sales dataset by navigating to Data > New Data Source. Select and import the file (e.g., another Excel workbook or database).
- Verify Matching Fields: Check for common dimensions between the primary and secondary datasets, such as “Region” or “Year.” These fields will act as blend relationships.
Pro Tip: Ensure that both datasets have at least one common dimension. If necessary, rename fields in Tableau to align them (e.g., rename “Zone” in one dataset to match “Region” in another).
Step 3: Blend Data
Blending data involves linking the primary and secondary datasets based on shared dimensions.
- Automatic Linking: Tableau automatically identifies common fields between datasets and creates a blend relationship. Look for an orange link icon next to matching fields in the Data Pane.
- Custom Blend Relationships: If Tableau does not auto-link fields, manually define blend relationships by clicking on broken link icons (gray) next to relevant fields. This activates the relationship.
Key Point: Data blending aggregates information independently from each data source before combining it. Unlike joins, it does not create row-level merges but works at an aggregated level.
Step 4: Visualize Results
Once data blending is complete, you can create compelling visualizations that combine insights from both datasets.
- Build Charts or Graphs: Drag blended fields into rows and columns shelves to create visualizations such as bar charts, line graphs, or scatter plots.
- Compare Metrics: Use blended data to compare car sales versus bike sales across regions or time periods.
- Refine Visualizations: Apply filters, sort options, or calculated fields for deeper analysis.
For example:
- Create a bar chart showing total sales for cars and bikes by region.
- Add a trend line to compare sales growth over months or years.
Expanded Example: Combining Car and Bike Sales Data
Imagine you are a regional sales manager analyzing performance across multiple product categories—cars and bikes. The car sales data is stored in an Excel file, while bike sales data resides in a cloud database. You want to combine these datasets without altering their original structures.
Step-by-Step Implementation
Step 1: Import Car Sales Data
- Connect Tableau to the Excel file containing car sales records.
- Drag fields like “Region,” “Sales Volume,” and “Year” onto your worksheet.
Step 2: Add Bike Sales Data
- Connect Tableau to the cloud database storing bike sales metrics.
- Ensure that shared dimensions like “Region” are available for blending.
Step 3: Blend Using Region Field
- Tableau automatically links both datasets using the “Region” field.
- If necessary, manually activate links by clicking on broken icons next to matching dimensions.
Step 4: Create Comparative Visualization
- Build a side-by-side bar chart comparing car sales and bike sales by region.
- Add filters for specific years or product categories (e.g., SUVs vs mountain bikes).
Conclusion
Data blending in Tableau is an essential tool for analysts working with diverse datasets from multiple sources. By following these detailed steps—importing primary and secondary datasets, defining blend relationships, and visualizing results—you can unlock valuable insights without restructuring databases or compromising efficiency.
Whether you are comparing product performance across categories or correlating financial metrics with marketing campaigns, mastering Tableau’s data blending feature ensures that you can tackle complex analytics challenges with ease while leveraging competitive keywords like “Tableau tutorial” and “custom blend relationships” for visibility in professional circles.
Frequently Asked Questions
What is Data Blending in Tableau, for example?
Data Blending in Tableau allows analysts to integrate data from disparate sources, such as sales figures from Excel, with customer data from SQL databases. Visualising sales performance alongside customer demographics provides deeper insights without merging datasets beforehand, simplifying complex data analysis tasks.
When is Blending used in Tableau?
Blending is employed in Tableau when datasets need to be analysed together without a direct relationship or when combining data from different sources like databases and spreadsheets. It avoids complex joins, making it ideal for quick exploratory analysis or when data integration at the visualisation level is required.
What are the Limitations of Data Blending in Tableau?
Data Blending in Tableau can suffer performance challenges, especially with large datasets or complex calculations. It does not support full outer joins and requires careful management of relationships between data sources, which can be cumbersome when handling multiple layers of blended data.
Authors
-

Written by:
Karan ThaparReviewed by: