Summary: Data Blending in Tableau combines data from different sources for comprehensive analysis. It is used when data cannot be joined directly and has limitations like performance issues and restricted join types.
Introduction
Data Blending in Tableau is a sophisticated technique pivotal to modern data analysis. With the exponential growth of data sources across industries, seamless integration and analysis have become paramount.
According to recent studies by leading analytics firms, organisations leveraging Data Blending techniques improve decision-making processes, with up to a 40% increase in data-driven insights.
Understanding the nuances of Data Blending in Tableau is crucial for extracting meaningful insights. This article will serve as your guide, navigating through the intricacies and empowering you to harness Tableau’s full potential.
What is Data Blending in Tableau?
Data Blending in Tableau is a technique for combining data from multiple sources. Unlike traditional data merging or joining, which requires a shared key and happens at the database level, Data Blending occurs at the visualisation level within Tableau.
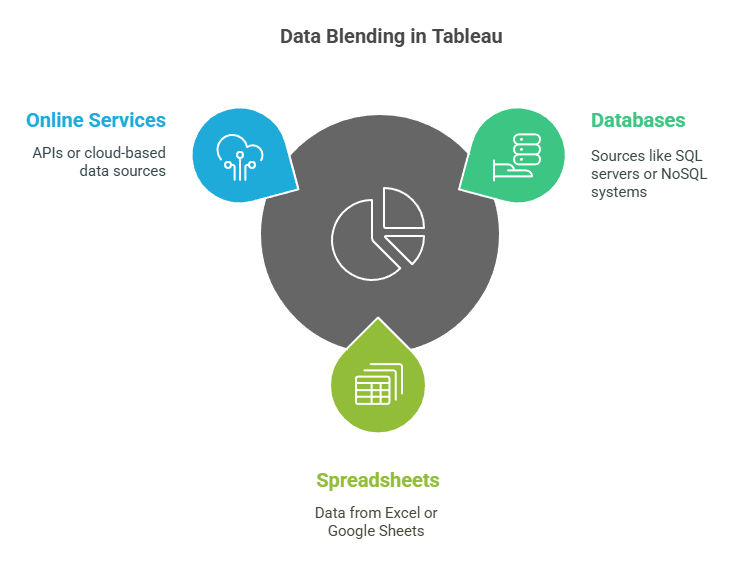
This allows users to integrate data from disparate sources, such as databases, spreadsheets, and online services, without needing to preprocess or combine the data beforehand.
How Data Blending Works in Tableau
To understand what Data Blending in Tableau is with an example, consider you have sales data in one source and customer data in another. You want to create a visualisation that shows sales by customer region.
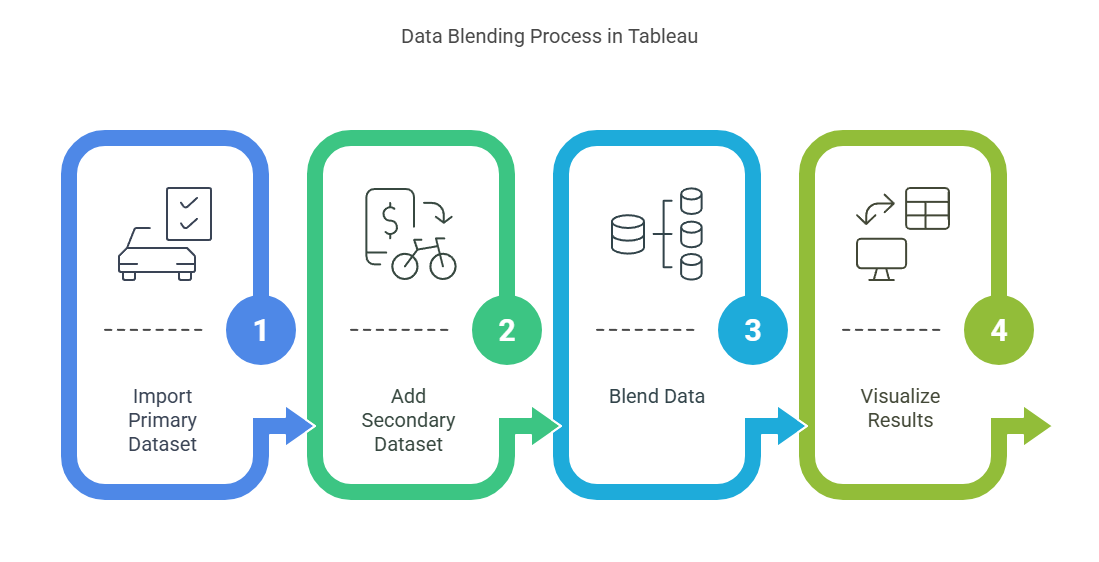
In Tableau, you can blend these datasets by designating a primary and a secondary data source. The primary data source drives the visualisation, and the secondary source provides related fields. Tableau creates a left join based on a common field, typically a date, product ID, or customer ID.
When you place fields from both data sources onto a view, Tableau links the data sources using the specified common field, performing a post-aggregation join. This method maintains each data source’s original granularity and aggregation, ensuring that calculations and aggregations are accurate and relevant.
Read More: Data Visualisation: Advanced Techniques for Insightful Analytics.
Comparison with Data Joining and Merging
Data Blending in Tableau differs from traditional data joining and merging in several ways.
- Data Joining: Occurs at the database level and combines tables based on standard keys, often resulting in a single, combined dataset. This method requires clean and consistent keys across all tables, and any discrepancies can lead to data loss or duplication.
- Data Merging: Typically involves combining data sources into one unified dataset before analysis, often requiring extensive preprocessing.
In contrast, Data Blending is more flexible and dynamic. It allows users to directly integrate data from different sources within Tableau without extensive preprocessing. This makes it particularly useful for exploratory data analysis and ad hoc reporting, where data sources may be inconsistent or constantly changing.
Understanding what Data Blending in Tableau Server entails involves recognising that the process is similar but occurs within a collaborative, server-based environment. This allows multiple users to access and combine data from various sources while leveraging Tableau’s robust data governance and security features.
When is Data Blending Used in Tableau?
Data Blending in Tableau is employed when combining data from different sources that cannot be directly joined. It allows you to integrate data from disparate databases, spreadsheets, or cloud services.
For example, you might have sales data in one database and marketing data in another. Data Blending lets you analyse both data sets without the need for complex SQL queries or data warehousing
Examples of When to Use Data Blending Instead of Data Joining
A typical scenario for Data Blending is when the data sources do not share common keys. Suppose you have regional sales data and demographic information. Still, the sales data uses region codes, while the demographic data uses region names. Data Blending in Tableau can merge these datasets on the fly, allowing for integrated analysis without preprocessing the data.
Another example is when dealing with aggregated data. Direct joining might not be feasible if you have daily sales data in one source and monthly sales targets in another. Data Blending allows you to match the different granularities, making it easier to compare actual sales against targets.
Situations Where Data Blending is Preferred
Data Blending is preferred when data needs to remain separate due to security or organisational policies. For instance, financial data might reside in a secure database, while operational data is in a less restricted environment. Blending these datasets in Tableau allows analysis of the combined information without moving or exposing sensitive data.
Moreover, when blending is used in Tableau, it simplifies the analysis process by enabling quick and flexible integration of various data sources, making it a powerful tool for comprehensive data analysis.
What is the Purpose of Using Metadata in Tableau?
Metadata in Tableau refers to the data about your data. It includes data source details, data types, field names, calculations, and relationships between different fields. Metadata provides a structured way to manage and organise data, ensuring consistency and accuracy throughout your analysis.
Importance of Metadata in Data Blending
Metadata plays a crucial role in Data Blending by defining how different data sources relate. When you blend data from multiple sources, Tableau uses metadata to identify common fields, also known as linking fields, that connect these sources.
Accurate metadata ensures that Tableau correctly matches data from different sources, providing a coherent and meaningful blended dataset. Blending can result in incorrect or incomplete data combinations without proper metadata, leading to flawed analyses and insights.
How Metadata Influences the Blending Process
Metadata directly influences the blending process by dictating how Tableau interprets and combines data from different sources. When you initiate a Data Blend, Tableau relies on metadata to establish primary and secondary data sources.
The primary data source provides the context for the analysis, while the secondary data source augments it with additional information. Metadata determines the linking fields Tableau uses to blend the data, ensuring the data integration is accurate and relevant.
Using metadata effectively can enhance the accuracy and efficiency of Data Blending in Tableau. It helps maintain data integrity, reduces the risk of errors, and allows you to create more insightful visualisations and analyses.
Metadata is the backbone of Data Blending, enabling Tableau to seamlessly combine diverse data sources into a unified, powerful dataset for comprehensive analysis.
Which join is used for Data Blending in Tableau?
In Tableau, Data Blending combines data from different sources to create a cohesive view for analysis. Joins play a critical role in determining how the data sets are merged.
A join-in Data Blending matches rows from different data sources based on related columns, known as keys. This merging allows users to analyse data from multiple sources without performing complex SQL queries.
Types of Joins Used in Data Blending
By default, Tableau uses a left join for Data Blending. This means the primary data source you initially connect to serves as the base table, and all rows from this table are included in the final result.
If the secondary data source has corresponding rows, these are added to the result. If no match is found, the result still includes rows from the primary source, with null values for columns from the secondary source.
Although left joins are the default, you can customise the blending to fit your needs. Tableau allows for inner joins through calculated fields or specific filter settings. However, Data Blending does not support advanced join types like right and full outer joins.
How Joins Affect the Outcome of Blended Data
The type of join used in Data Blending significantly impacts the analysis results. With a left join, you ensure that all data from the primary source appears in the final output, which is useful when the primary data source contains all the essential information.
However, any unmatched records from the secondary source will result in null values, which can lead to incomplete insights if the secondary data is also crucial.
Using the appropriate join type ensures the accuracy and completeness of your blended data. Understanding these nuances allows you to harness the full power of Tableau’s Data Blending capabilities, leading to more insightful and comprehensive data analyses.
Benefits of Using Data Blending in Tableau
Data Blending in Tableau provides a robust method for combining data from different sources to create comprehensive visualisations. This capability allows users to analyse data more effectively, uncover insights, and confidently make data-driven decisions.
Data Blending offers several key advantages that enhance your data analysis capabilities in Tableau. By leveraging this feature, you can:
- Integrate Diverse Data Sources: Seamlessly combine data from various sources, such as databases, spreadsheets, and cloud services, to create a unified view.
- Enhance Flexibility: Easily blend data without needing to join tables or modify the original datasets, providing flexibility in data preparation.
- Save Time: Quickly integrate data without complex ETL processes, reducing the time and effort required for data preparation.
Must Read: Top ETL Tools: Unveiling the Best Solutions for Data Integration.
How Data Blending Enhances Data Analysis and Visualisation
Data Blending in Tableau significantly enhances data analysis and visualisation by allowing users to work with comprehensive datasets. This results in more accurate and insightful visualisations.
- Enhanced Data Analysis: Blending data from multiple sources helps identify trends, patterns, and correlations that might not be apparent when analysing individual datasets separately.
- Improved Visualisation: By integrating diverse datasets, users can create more detailed and informative visualisations, providing a clearer understanding of the data.
- Interactive Dashboards: Data Blending enables the creation of interactive dashboards that dynamically update as new data is blended, offering real-time insights.
Examples of Successful Data Blending Implementations
By leveraging the benefits of Data Blending in Tableau, organisations can enhance their data analysis, create more effective visualisations, and drive better business outcomes. Successful implementations of Data Blending in Tableau demonstrate its power and versatility. Here are a few examples:
- Sales and Marketing Integration: By blending sales data with marketing campaign data, companies can analyse the impact of marketing efforts on sales performance and adjust strategies accordingly.
- Financial Reporting: Organisations can blend financial data from different departments to create comprehensive financial reports, ensuring accuracy and consistency across the board.
- Customer Insights: Blending customer data from CRM systems with transactional data allows businesses to gain deeper insights into customer behaviour and preferences, leading to more personalised marketing efforts.
Limitations of Data Blending in Tableau
Data Blending in Tableau is a powerful tool but has limitations. Understanding these constraints is crucial for maximising the effectiveness of your data analysis and ensuring accurate insights.
While Data Blending offers flexibility, it also has specific challenges that users must navigate to ensure accurate results.
- Performance Issues: Blending large datasets can significantly slow performance.
- Limited Join Types: Data Blending primarily uses left joins, which might not always meet complex data requirements.
- Dependency on Primary Data Source: The primary data source drives the analysis, potentially overshadowing secondary data sources.
- Aggregate Data Handling: Data Blending can complicate the handling of aggregated data, sometimes leading to misleading results.
These challenges highlight the importance of understanding when and how to use Data Blending effectively.
Situations Where Data Blending May Not Be Effective
In some scenarios, Data Blending might not be the best approach. Recognising these situations can help you choose more suitable data integration and analysis methods.
- Complex Joins Required: When your analysis needs complex joins (e.g., inner, outer), Data Blending’s left join limitation can be restrictive.
- Performance-Sensitive Applications: In cases where quick response times are crucial, blending large datasets can cause performance bottlenecks.
- Uniform Data Sources: If all data resides in the same database, a direct join might be more efficient and straightforward than Data Blending.
Alternatives to Data Blending in Certain Cases
When Data Blending isn’t practical, alternative approaches can provide better performance and flexibility. Thus, considering these alternatives, you can optimise your data analysis process and achieve more accurate and efficient results.
- Data Joins: When working with data from the same source, use Tableau’s native data joining capabilities.
- Data Integration Tools: Employ ETL (Extract, Transform, Load) tools like Alteryx or Talend to preprocess and integrate data before importing it into Tableau.
- Custom SQL Queries: Write custom SQL queries to handle complex joins and aggregations directly within Tableau, ensuring precise data manipulation.
Data Blending in Tableau vs. Data Blending in Power BI
Data Blending is a powerful feature in Tableau and Power BI, enabling users to combine data from multiple sources. However, each tool has unique capabilities, strengths, and weaknesses. This section compares Data Blending in Tableau and Power BI, highlighting their differences and offering use cases for each platform.
Tableau and Power BI each offer distinct advantages in Data Blending. Tableau is user-friendly and excels at visualisation, while Power BI integrates well with Microsoft tools and handles complex data modelling effectively.
Data Blending vs Joins
The difference between Data Blending and joins is crucial for practical data analysis. While both techniques combine data, they serve different purposes and have unique strengths and limitations. This section provides a detailed comparison of Data Blending and joins, highlighting their key features and use cases.
Data Blending is best for combining disparate sources with different structures, while joins are more efficient for merging related tables with common keys within a database. Each method has advantages depending on the data integration needs and performance considerations.
Frequently Asked Questions
What is Data Blending in Tableau, for example?
Data Blending in Tableau allows analysts to integrate data from disparate sources, such as sales figures from Excel, with customer data from SQL databases. Visualising sales performance alongside customer demographics provides deeper insights without merging datasets beforehand, simplifying complex data analysis tasks.
When is blending used in Tableau?
Blending is employed in Tableau when datasets need to be analysed together without a direct relationship or when combining data from different sources like databases and spreadsheets. It avoids complex joins, making it ideal for quick exploratory analysis or when data integration at the visualisation level is required.
What are the limitations of Data Blending in Tableau?
Data Blending in Tableau can suffer performance challenges, especially with large datasets or complex calculations. It does not support full outer joins and requires careful management of relationships between data sources, which can be cumbersome when handling multiple layers of blended data.
Conclusion
Data Blending in Tableau is not just a technique; it’s a transformative approach to data analysis. This comprehensive guide has illuminated the nuances, advantages, and challenges of Data Blending in Tableau. As businesses navigate the data-rich landscape, mastering this art becomes imperative for staying ahead in the competitive curve.
At Pickl.AI, you will not only master the concepts of Data Science, but will also learn the right techniques that make you an expert data professional. So, log on to Pickl.AI to explore our Data Science courses that will seamlessly transition your career into the data domain.