Summary: Central tendency in statistics helps summarise datasets using mean, median, and mode. Each measure provides insights into data distribution and patterns. The mean is helpful for trends, the median works for skewed data, and the mode identifies common values. Choosing the right measure ensures accurate research, business, and finance analysis.
Introduction
When we analyse data, we often ask: What is the average? What is the typical value? That’s where central tendency in statistics comes in. It helps us find a single value representing a whole set of numbers, making data easier to understand.
Why is this important? Whether you track expenses, exam scores, or business sales, central tendency helps you quickly sense numbers.
In this blog, you’ll learn about the three key measures—Mean, Median, and Mode. By the end, you’ll know when and how to use them. Let’s dive in!
Key Takeaways
- The mean, median, and mode are the three main measures of central tendency in statistics.
- The mean calculates the average, but it is affected by outliers in skewed data.
- The median is the middle value and is best for highly varied data.
- The mode identifies the most frequently occurring value in a dataset.
- Choosing the right measure depends on data distribution and real-world application needs.
What Are Measures of Central Tendency?
When you collect a lot of numbers, it’s not always easy to make sense of them. Measures of central tendency help you find a single number representing the entire dataset. Simply put, they give you the “average” or the most typical value in a group of numbers.
Imagine you have test scores for a whole class. Instead of looking at each score individually, you can use central tendency to get an overall idea of how well the class performed. It helps you summarise big chunks of data into a single meaningful number.
The three main measures of central tendency are mean, mode and median. I will describe each in detail in the later sections of the blog.
Mean (Arithmetic Mean)
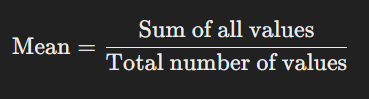
The mean, or arithmetic mean, is the most common way to find the average of a set of numbers. It is calculated by adding all the numbers in a dataset and dividing by the total values. The mean gives a single value representing the entire dataset, making it helpful in understanding trends and patterns.
The mean is widely used in statistics because it provides a quick data summary. It helps researchers, analysts, and businesses make informed decisions based on numerical data. For example, companies use the mean to analyse customer spending habits, and schools use it to determine students’ average test scores.
How to Calculate the Mean (Example)
The formula for calculating the mean is:
Example Calculation
Imagine you want to find the average score of five students in a math test. Their scores are 75, 80, 90, 85, and 70.
- Add all the scores:
75 + 80 + 90 + 85 + 70 = 400 - Count the total number of students: 5
- Divide the sum by the number of students:
400 ÷ 5 = 80
So, the average score (mean) is 80.
Applications of Mean
The mean is widely used in various fields:
- Business Analytics: Companies analyse sales data to find the average revenue per customer.
- Finance: Investors use the mean to calculate average stock prices or returns.
- Research: Scientists use the mean to summarise experimental results.
- Education: Schools use the mean to calculate average exam scores.
Pros of Mean
- Easy to calculate and interpret: Using simple arithmetic, anyone can find the mean.
- Considers all values: It includes every number in the dataset, making it a balanced representation of the data.
Cons of Mean
- Affected by outliers: A single extreme value (too high or too low) can distort the mean, making it unreliable in such cases.
- Not ideal for skewed data: The mean might not reflect the actual trend if the data is unevenly distributed.
The arithmetic mean is a valuable tool for understanding data, but it is crucial to consider its limitations when analysing real-world information.
Median
The median is the middle value in a set of numbers arranged in order. Unlike the mean, which considers all values, the median focuses only on the central point of a dataset. This makes it a useful measure of central tendency, mainly when the data contains extreme values or is unevenly distributed.
The median helps handle skewed data; some numbers are significantly higher or lower than the rest. The mean can be misleading because outliers (extraordinarily high or low values) can distort the average. The median, however, remains stable and provides a more accurate representation of the dataset.
How to Calculate the Median (Example)
To find the median, follow these steps:
For an Odd Number of Values:
- Arrange the numbers in ascending order.
- Identify the middle number.
Example:
Dataset: 5, 8, 12, 15, 20
Middle value: 12 (This is the median)
For an Even Number of Values:
- Arrange the numbers in ascending order.
- Find the two middle numbers.
- Calculate their average.
Example:
Dataset: 4, 10, 14, 18, 22, 26
Middle values: 14 and 18
Median: (14 + 18) ÷ 2 = 16
Applications of Median
- Income Distribution: Economists use the median to determine the typical income in a country, avoiding distortions caused by very high or low salaries.
- Real Estate Pricing: Property analysts use the median home price to get a realistic market value, avoiding the impact of extremely expensive or cheap houses.
- Social Sciences: Researchers use the median to analyse survey data when responses vary widely.
Pros of Median
- Not affected by outliers: Unlike the mean, the median remains stable even if the dataset has extreme values.
- More representative in skewed data: The median gives a more accurate picture of typical values like income levels or housing prices.
Cons of Median
- Ignores all data points except the middle one: Since it does not consider every value, it may not provide the best summary in some situations.
- Not ideal for advanced statistical models: The median is more complicated to use in mathematical calculations than the mean.
The median is a powerful tool for understanding data, especially when dealing skewed distributions. It provides a realistic central value not affected by extreme numbers, making it useful in many real-world applications.
Mode
The mode is the value that appears most frequently in a dataset. Unlike the mean and median, the mode focuses on repetition rather than calculation. If a number or category appears more often than any other, it is called the mode.
The mode is handy for categorical data, such as survey responses, product preferences, or election results. For example, if a clothing store sells five different colors of shirts, the most popular color (the one sold the most) is the mode. In numerical data, such as exam scores, the mode helps identify the most common score.
How to Determine the Mode (Example)
To find the mode, identify the value that appears most often. A dataset can have:
- One mode (Unimodal): Example – In the numbers 2, 3, 3, 5, 7, the mode is 3 because it appears twice.
- Two modes (Bimodal): Example – In 4, 4, 6, 6, 8, both 4 and 6 are modes.
- More than two modes (Multimodal): Example – In 1, 2, 2, 3, 3, 4, 4, the modes are 2, 3, and 4.
- No mode: If all values appear the same number of times, there is no mode.
For categorical data, suppose a survey asks 100 people their favorite fruit, and 40 choose mango, 35 choose apple, and 25 choose banana. The mode is mango because it was chosen the most.
Applications of Mode
- Market Research: Companies use mode to find the most popular product or customer preference.
- Product Demand Analysis: Retailers track which size or color sells the most.
- Voting Patterns: Political analysts determine the most common voter choice.
Pros of Mode
- Works for both numbers and categories: It helps analyse numeric and non-numeric data trends.
- Easy to find in small datasets: It requires simple observation rather than complex calculations.
Cons of Mode
- May not exist or may have multiple values: Some datasets have no mode, while others have several, making interpretation tricky.
- Not useful for continuous data: The mode loses significance when values vary widely without repetition.
The mode is a simple but powerful tool for analysing trends, especially in non-numeric data. However, it should be used carefully in datasets with multiple or no modes.
Central Tendency in Different Types of Data Distributions
When working with data, it’s essential to understand how different distributions affect the measures of central tendency—mean, median, and mode. How data is spread out can change how these measures behave, making it crucial to choose the right one for accurate analysis.
Symmetric vs. Skewed Distributions
A symmetric distribution looks balanced on both sides when plotted on a graph. In such cases, the mean, median, and mode are usually the same or very close to each other. An example is the bell-shaped normal distribution, where data points are evenly spread.
A skewed distribution, on the other hand, is uneven. If a distribution is right-skewed (positively skewed), most data points are on the lower end, but a few very high values pull the mean toward the right.
In a left-skewed (negatively skewed) distribution, most values are on the higher end, while a few very low values pull the mean toward the left. In both cases, the median is better than the mean because extreme values don’t affect it.
How Measures of Central Tendency Behave in Different Distributions
- In symmetric distributions, mean, median, and mode are almost the same, making the mean a good measure of central tendency.
- In right-skewed distributions, the mean is greater than the median, while the mode is the smallest.
- In left-skewed distributions, the mean is the smallest, the median is in the middle, and the mode is the largest.
Impact of Outliers on Mean, Median, and Mode
Outliers are values much higher or lower than the rest of the data. They significantly affect the mean, making it unreliable in skewed distributions. The median remains stable because it only considers the middle value, while the mode stays unaffected unless the outlier repeats frequently. The median is often the best choice when data has extreme values.
Other Types of Means in Statistics
Apart from the commonly used arithmetic mean, other types of means in statistics help in different situations. These include the weighted mean, geometric mean, and harmonic mean. Each of these means is useful for specific types of data and calculations. Let’s understand them in simple terms.
Weighted Mean
The weighted mean is similar to the arithmetic mean but gives more importance to specific values. Instead of treating all numbers equally, it assigns weights based on their significance.
Example:
Imagine you have a course where assignments count for 40% of the final grade and exams count for 60%. If you score 80 on assignments and 90 on exams, the weighted mean would be:
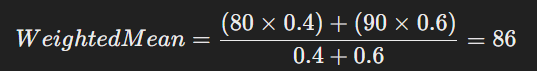
This method ensures that more essential values contribute more to the final result.
Geometric Mean
The geometric mean is used when numbers are multiplied together rather than added. It helps measure growth rates, such as population growth, stock market returns, or interest rates.
Example:
If a company’s revenue grows by 10% in the first year, 20% in the second year, and 30% in the third year, the geometric mean growth rate is:

This gives a more accurate measure of consistent growth over time.
Harmonic Mean
The harmonic mean is useful when dealing with rates, such as speed, efficiency, or ratios. It gives more importance to smaller values, making it useful in real-world problems like average speed calculations.
Example:
If a car travels 60 km/h for half the distance and 40 km/h for the other half, the harmonic mean speed is:

This ensures a fair calculation of speed when different distances are covered at different rates.
These special types of means help in different scenarios where the arithmetic mean may not be accurate. Understanding them can improve data analysis in business, finance, and science fields.
In Closing
Understanding measures of central tendency in statistics—mean, median, and mode—helps make sense of numerical data. Each measure has strengths and is suited for different types of data distribution. While the mean provides an overall average, the median is helpful for skewed data, and the mode identifies the most frequent value.
Mastering these concepts is essential for business, finance, and research data analysis. Want to deepen your knowledge? Learn statistics and other vital data science concepts by joining the free data science course by Pickl.AI. Take the first step toward becoming a data expert and unlocking exciting career opportunities.
Frequently Asked Questions
What are the Three Measures of Central Tendency in Statistics?
The three measures of central tendency are mean, median, and mode. The mean represents the average, the median is the middle value, and the mode is the most frequently occurring number in a dataset. These measures help summarise and interpret numerical data effectively.
When Should You Use the Median Instead of the Mean?
Use the median instead of the mean when the dataset has outliers or is skewed. The median provides a better central value because extreme values do not affect it. This makes it ideal for income distribution, property prices, and other cases with significant numerical variations.
How does Central Tendency Help in Business Analytics?
Central tendency helps businesses analyse customer behavior, sales trends, and financial performance. The mean calculates average revenue, the median provides insights on typical transaction values, and the mode identifies popular products. These insights help businesses make data-driven decisions for pricing, inventory, and marketing strategies.
Authors
-

Written by:
Aashi VermaReviewed by: